Enter your numbers and see every step.
Loading calculator…
This free online standard deviation calculator gives you the standard deviation, variance, mean (the average) and standard error in one go. It works as a sample standard deviation calculator and as a population standard deviation calculator: choose Sample or Population, and the result and working follow your choice. Every result comes with a step-by-step table, so you can check the working.
How to use this standard deviation calculator
- Enter your data. Type your numbers or paste them in, separated any way you like.
- Choose Sample or Population. Pick Sample if your numbers are part of a larger group, or Population if they are the whole group.
- Press Calculate. The results and the full working appear below the tool.
If your data contains text or symbols, this SD calculator lists what it skipped, so nothing changes your result without you knowing. Your numbers stay in your browser.
What is standard deviation?
Standard deviation (SD) measures spread: how far the values in a data set typically sit from their average (mean). It is written σ (sigma) for a population and s for a sample. A small SD means the values are close together, and a large SD means they are spread out.
It comes from the variance. You square each value’s distance from the mean, add the squares and divide by N, or by n − 1 for a sample. That gives the variance, in squared units. Taking the square root brings you back to the original units, so the standard deviation has the same units as your data: data in dollars gives a standard deviation in dollars. Variance and standard deviation are both measures of variability, which is why this variance and standard deviation calculator gives you both.
What your result means
For data that is roughly bell-shaped, about 68% of values fall within 1 SD of the mean, about 95% within 2 SDs and about 99.7% within 3 SDs. This is called the empirical rule. For example, if test scores have a mean of 70 and an SD of 8, about 68% of scores fall between 62 and 78, about 95% between 54 and 86 and about 99.7% between 46 and 94. To see your own data against these bands, use the bell-curve SD graph

An SD only makes sense next to its mean. An SD of 5 is large when the mean is 10, but small when the mean is 1,000. To compare spread across different scales, divide the SD by the mean to get the relative spread (coefficient of variation). The variance, which is the SD squared, has its own calculator for variance with the sum of squares. To see the mean next to the median and mode of the same numbers, use the mean, median and mode tool.
To see how unusual one value is, find its z-score: (x − mean) / SD. A z-score of 1 means the value is one standard deviation above the mean, and the normal table (z table) turns any z-score into a percentage.
Standard deviation formula
Population standard deviation
σ = √[ Σ(xᵢ − μ)² / N ]
Sample standard deviation
s = √[ Σ(xᵢ − x̄)² / (n − 1) ]
- xᵢ is each value in the data set.
- μ is the population mean and x̄ is the sample mean.
- N is the number of values in a population and n the number in a sample.
- Σ means add them all up.

Why square the differences? The distances above and below the mean always add up to zero, so squaring makes every distance positive before they are added.
Sample vs population standard deviation
If you measured every member of the group, such as all 2,000 students in a school, use the population SD (σ) and divide by N. If you measured only some of them, such as 50 students, to learn about the whole school, use the sample SD (s) and divide by n − 1.
Why n − 1? A sample’s values sit closer to their own mean than to the true population mean, so dividing by n would make the spread look too small. Dividing by n − 1, called Bessel’s correction, gives an unbiased estimate of the population variance. A sample needs at least 2 values; with one value the sample SD cannot be calculated, while the population SD is 0.
| Measure | Population | Sample |
|---|---|---|
| Symbol | σ | s |
| Mean used | μ | x̄ |
| Divide by | N | n − 1 |
| Excel and Google Sheets | STDEV.P | STDEV.S |
| TI-83 and TI-84 | σx | Sx |
How to find standard deviation by hand
Here is how to calculate standard deviation by hand for a small data set, in six steps. To find the standard deviation of a data set that is a sample, divide by n − 1 in step 5.
- Find the mean: add all values and divide by how many there are.
- Subtract the mean from each value.
- Square each result.
- Add the squares. This is the sum of squares (SS).
- Divide by n − 1 for a sample or N for a population. This is the variance.
- Take the square root. This is the standard deviation.
The most common mistake is using N when you have a sample, or n − 1 when you have the whole population. When you have two paired lists instead of one, the covariance tool for paired lists uses the same n − 1 rule to show how they move together.
Worked example: five quiz times
Five students took 12, 15, 18, 20 and 25 minutes to finish a quiz. Treat them as a sample. Press Example in the calculator to load the same numbers and check every step.
Step 1, mean: x̄ = (12 + 15 + 18 + 20 + 25) / 5 = 90 / 5 = 18.
| x | x − x̄ | (x − x̄)² |
|---|---|---|
| 12 | −6 | 36 |
| 15 | −3 | 9 |
| 18 | 0 | 0 |
| 20 | 2 | 4 |
| 25 | 7 | 49 |
| Total | 0 | 98 |
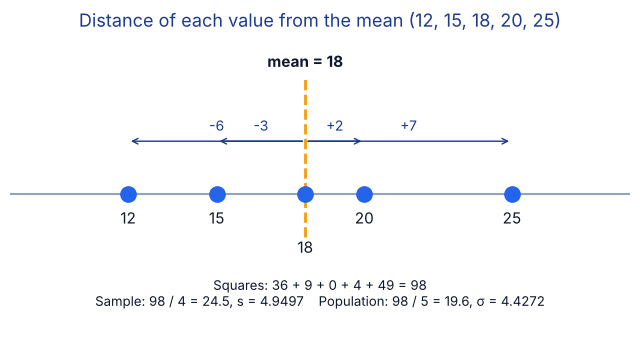
- Sum of squares: SS = 98
- Sample variance: s² = 98 / (5 − 1) = 24.5
- Sample standard deviation: s = √24.5 = 4.9497
- If the five times were the whole population: σ² = 98 / 5 = 19.6 and σ = √19.6 = 4.4272
- Standard error of the mean: SE = 4.9497 / √5 = 2.2136
Notice that the population SD is smaller. Dividing by 5 instead of 4 always gives a smaller answer, which is why choosing the right option matters.
Standard deviation vs variance vs standard error
| Measure | What it tells you | Formula (sample) |
|---|---|---|
| Variance | Spread, in squared units | s² = Σ(x − x̄)² / (n − 1) |
| Standard deviation | Spread, in the data’s own units | s = √s² |
| Standard error of the mean | How precisely the sample mean estimates the population mean | SE = s / √n |
The standard deviation describes your data. The standard error describes your sample mean: it shrinks as the sample grows, and it is the starting point for margins of error and confidence intervals. To work out the standard error for your own numbers, use the standard error of the mean calculator.
Standard deviation in Excel, Google Sheets and a TI-84
- Sample: =STDEV.S(A1:A20)
- Population: =STDEV.P(A1:A20)
- Older Excel: =STDEV() for a sample and =STDEVP() for a population
- TI-83 or TI-84: STAT → EDIT, enter the data in L1, then STAT → CALC → 1-Var Stats. Sx is the sample SD and σx is the population SD.
These give the same answers as this calculator, so you can use them to check your work. For a worked example with the common errors and fixes, see our guide to standard deviation in Excel.
Where standard deviation is used
- Exam scores: two classes can have the same average, but the one with the smaller SD scored more consistently.
- Quality control: factories track the SD of part sizes. A rising SD warns that a machine is drifting.
- Finance: the SD of returns is a common measure of risk.
- Research: the SD and the standard error are used to report results and to build confidence intervals.
- Counts of events: when counts follow a Poisson distribution, the SD is the square root of the average rate, so 9 calls per hour gives an SD of 3 (see the Poisson probability tool).
- Unusual values: a z-score shows how many SDs a value is from the mean (see the z-score table).
Standard deviation FAQs
Should I use sample or population standard deviation?
Use population if your data includes every member of the group. Use sample if it is only part of the group. When you are not sure, it is usually a sample.
Why does the sample formula divide by n − 1?
A sample sits closer to its own mean than to the population mean, so dividing by n would make the spread look too small. Dividing by n − 1 (Bessel’s correction) gives an unbiased estimate of the variance, and it matters most for small samples.
What does a standard deviation tell me?
It tells you how far values typically are from the mean. A small standard deviation means the values are consistent, and a large one means they are spread out.
What is a good standard deviation?
There is no single good or high value, because a standard deviation only makes sense next to the mean and the units of your data. An SD of 5 is large when the mean is 10 but small when the mean is 1,000. A lower SD means more consistent values, which is what you want for something like part sizes. To compare spread across different scales, divide the SD by the mean.
Can standard deviation be negative?
No. Standard deviation is the square root of an average of squared distances, so it is always 0 or more. It is 0 only when every value in the data set is the same. If you get a negative result, check your working.
What is the difference between a z-score and a standard deviation?
The standard deviation is the typical spread of the whole data set. A z-score says how many standard deviations one value is from the mean.
What is the difference between standard deviation and standard error?
The standard deviation measures how spread out your data is. The standard error, the SD divided by the square root of n, measures how precisely your sample mean estimates the population mean.
Can I calculate a sample standard deviation from one number?
No. With one value, n − 1 is 0, so the sample formula cannot be calculated and the calculator says it needs at least 2 values. The population standard deviation of a single value is 0.
Can I paste data straight from Excel or Google Sheets?
Yes. Copy a column or a row and paste it into the box. New lines, commas, spaces and tabs all work.
Does this calculator find the mean and standard deviation together?
Yes. Every result shows the mean (average), standard deviation, variance, count, sum, sum of squares and standard error at once, with the working.
Is standard deviation the same as variability?
Standard deviation is one measure of variability. Others are the variance, the range, the interquartile range and the mean absolute deviation, which the MAD calculator finds. This calculator gives the standard deviation, variance and standard error, and our statistics calculator also gives the range and the interquartile range.
Easy Stat Calc · Results checked against Python (NumPy and SciPy), R and Excel · Last updated November 10, 2026 · Methodology