
Find the chance of A given that B happened from probabilities, counts or a 2×2 table, or update a probability with Bayes’ theorem, with the working and a tree that shows the numbers.
Loading calculator…
This conditional probability calculator finds P(A|B), the probability of A given B, in four ways. Enter P(A and B) and P(B), type the four counts of a 2×2 table, or use the Bayes’ theorem tab when you know a prior probability and the two test rates. It accepts decimals (0.25), percents (25%) and fractions (1/4), and it shows the exact fraction when you type one.
Every result from this conditional probability calculator shows its working, so you can see how to calculate conditional probability by hand. The Bayes’ theorem calculator tab adds a table of 1,000 people and a probability tree, which makes it clear why a conditional probability can differ from the number you started with.
How to use this conditional probability calculator
- From probabilities: enter P(A and B) and P(B). Add P(A) if you also want P(B|A) and the independence check.
- From a 2×2 table: enter the four counts (A and B, A and not B, not A and B, not A and not B). You get all six probabilities, and the cells used as the divisor are outlined.
- Bayes’ theorem: enter the prior P(A), the chance of B when A is true, and either the false positive rate or the specificity. You get P(B), the posterior P(A|B), a table out of 1,000 people and the tree.
- Tree diagram: shows the same numbers as branches. The two leaves that add up to P(B) are outlined and tagged B.
- Try an example: the buttons fill in an exam table, a medical test and two kings from a deck.
If P(B) is 0 the result is “undefined”, and if P(A and B) is larger than P(B) the tool tells you the numbers cannot both be right.
What is conditional probability?
Conditional probability is the probability of one event when you already know another event happened. Writing P(A|B), the bar means “given”. Instead of asking how many of all outcomes have A, you look only at the outcomes where B is true and ask how many of those also have A. For example, the chance that a randomly chosen student passed is different from the chance that a student passed given that they studied. It appears whenever new information changes a chance, such as a test result, a card already drawn or a subgroup in a survey.
| Symbol | Read as | Meaning |
|---|---|---|
| P(A|B) | probability of A given B | Chance of A among the cases where B happened |
| P(B|A) | probability of B given A | Chance of B among the cases where A happened |
| P(A and B) | probability of A and B | Chance that both happen together |
| P(A) | probability of A | Chance of A with no condition (the prior in Bayes’ theorem) |
This is a different job from finding the chance of two separate events. For independent or mutually exclusive events, see the basic probability calculator.
Conditional probability formula
The conditional probability formula divides the chance of both events by the chance of the event you are given:
- P(A|B) = P(A and B) ÷ P(B), with P(B) greater than 0.
- From counts: P(A|B) = count(A and B) ÷ count(B).
- Multiplication rule: P(A and B) = P(A|B) × P(B) = P(B|A) × P(A).
For example, if P(A and B) = 0.21 and P(B) = 0.6, then P(A|B) = 0.21 ÷ 0.6 = 0.35. The formula rescales the joint probability so that B becomes the whole sample space. The complement follows directly: P(not A|B) = 1 − P(A|B) = 0.65.
How to calculate conditional probability: worked example
A class of 200 students is sorted by whether they studied (B) and whether they passed (A). 80 studied and passed, 30 passed without studying, 20 studied and failed, and 70 neither studied nor passed.
| Studied (B) | Did not study | Total | |
|---|---|---|---|
| Passed (A) | 80 | 30 | 110 |
| Failed | 20 | 70 | 90 |
| Total | 100 | 100 | 200 |
- Pick the condition. We are told the student studied, so B is the column that sums to 100.
- Count A and B. 80 students passed and studied.
- Divide by the total for B. P(A|B) = 80 ÷ 100 = 0.8, or 80%.
- Check the denominator. It is 100, the students who studied, not the 200 in the whole class.
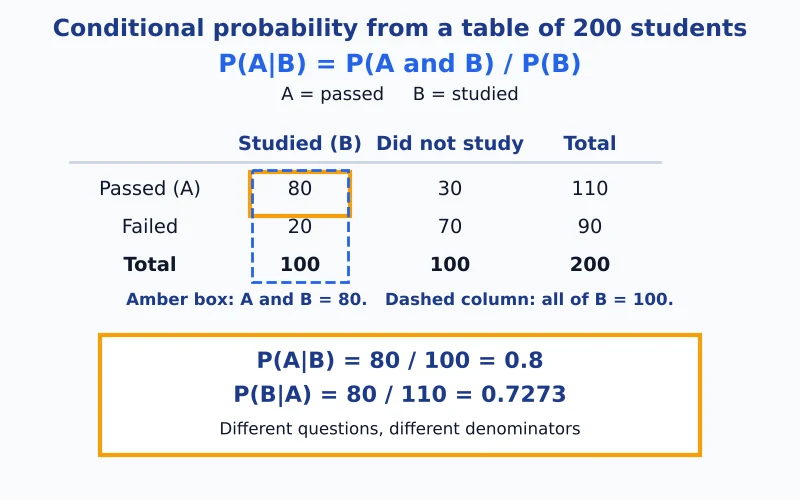
Paste the four counts into the 2×2 table tab of the conditional probability calculator to see all six probabilities at once, including P(A|not B) = 30 ÷ 100 = 0.3, which shows that studying changed the chance of passing.
P(A|B) versus P(B|A)
The two conditional probabilities use different divisors, so they are usually different numbers. In the exam table the chance of passing given studying is 80 ÷ 100 = 0.8, but the chance of studying given passing is 80 ÷ 110 = 0.7273. Mixing them up is the most common error in conditional probability problems.
| Question | Counts | Value |
|---|---|---|
| P(passed | studied) = P(A|B) | 80 of 100 | 0.8 |
| P(studied | passed) = P(B|A) | 80 of 110 | 0.7273 |
When you know one direction and need the other, use Bayes’ theorem below.
Bayes’ theorem calculator: updating a probability
Bayes’ theorem (also called Bayes’ rule or the Bayes formula) turns P(B|A) into P(A|B). The formula is P(A|B) = P(B|A) × P(A) ÷ P(B), where the bottom comes from adding the two ways B can happen: P(B) = P(B|A) × P(A) + P(B|not A) × P(not A). Here P(A) is the prior, P(B|A) is often called the sensitivity, and P(B|not A) is the false positive rate (one minus the specificity).
Take a prior of 1%, a sensitivity of 90% and a false positive rate of 5%. Then P(B) = 0.9 × 0.01 + 0.05 × 0.99 = 0.0585, and P(A|B) = 0.009 ÷ 0.0585 = 2/13, about 15.38%. Seen as 1,000 people, 10 have A and 9 of them are B-positive, while 990 do not have A and 49.5 of them are B-positive anyway. So 9 of the 58.5 B-positive people have A. Multiplying along a branch of the tree gives the joint probability, for example 0.01 × 0.9 = 0.009 for A and B-positive.

The small prior is why the posterior is far below the sensitivity. This is an illustration of the arithmetic only, not medical advice. In the tool, the Bayes theorem calculator tab shows the same table of 1,000 people and the tree for your own numbers.
Common mistakes with conditional probability
- Dividing by the wrong total. The divisor is P(B), the event you are given, not P(A). With counts it is the total for B, not the grand total.
- Swapping P(A|B) and P(B|A). They answer different questions, as the exam table shows (0.8 and 0.7273).
- Ignoring the prior. A test with a high sensitivity can still give a low P(A|B) when A is rare, as in the tree above.
- Conditioning on an impossible event. If P(B) = 0 the answer is undefined, not 0.
- Rounding too early. Keep full precision in P(A and B) and P(B), and round only the final answer.
Independence and drawing without replacement
Two events are independent when P(A|B) = P(A), so B carries no information about A. If you enter P(A) in the first tab, the calculator compares the two values and says whether A and B look positively related, negatively related or independent.
Drawing without replacement is a classic case of dependence. After one king leaves a 52-card deck, the chance that the next card is also a king is 3 ÷ 51 = 1 ÷ 17 = 0.0588. Enter P(A and B) = 1/221 and P(B) = 1/13 to check it. For counting successes over several draws, the hypergeometric calculator for draws without replacement is the better tool.
Conditional probability in Excel and on a TI-84
| Situation | Spreadsheet formula | TI calculator |
|---|---|---|
| P(A and B) in B2, P(B) in B3 | =B2/B3, or =IF(B3=0,”undefined”,B2/B3) | Home screen: P(A and B) / P(B), then ENTER |
| Raw 0/1 columns, A in A2:A101 and B in B2:B101 | =COUNTIFS(A2:A101,1,B2:B101,1)/COUNTIF(B2:B101,1) | No built-in command; count with your lists, then divide |
Neither calculator model has a conditional probability command, so the division is done by hand. The line under the result in the conditional probability calculator is filled in with your own numbers.
Related probability calculators
The probability calculator covers one event, two events and repeated tries. The hypergeometric calculator handles draws without replacement, and the probability hub lists every probability tool on the site.
Conditional probability calculator FAQs
What is conditional probability?
Conditional probability is the chance that event A happens when you already know that event B happened. It is written P(A|B) and read “the probability of A given B”. Knowing B shrinks the list of possible outcomes to the ones where B is true, and you then ask how many of those also have A.
What is the conditional probability formula?
P(A|B) = P(A and B) ÷ P(B), as long as P(B) is greater than 0. The top is the chance that both events happen, and the bottom is the chance of the event you were told about. With P(A and B) = 0.21 and P(B) = 0.6 the answer is 0.35.
How do you calculate conditional probability from a table?
Take the count in the cell where A and B overlap and divide by the total of the column or row for B. In the table above, 80 students passed and studied, 100 studied in total, so P(passed | studied) = 80 ÷ 100 = 0.8. The divisor is the total for B, never the grand total of 200.
What happens if P(B) is 0?
Then P(A|B) is undefined. You cannot condition on an event that cannot happen, because the formula would divide by zero. The calculator says “undefined” instead of showing 0.
Can conditional probability be greater than 1?
No. It is a probability, so it lies between 0 and 1. A result above 1 means a mistake in the inputs: check that P(A and B) is not larger than P(B), which would be impossible, since A and B together cannot be more likely than B alone.
What is the difference between P(A|B) and P(B|A)?
They answer different questions and usually have different values. In the exam table P(passed | studied) is 0.8, but P(studied | passed) is 80 ÷ 110 = 0.7273. Swapping them is a common mistake, and Bayes’ theorem is the tool that converts one into the other.
What is Bayes’ theorem?
Bayes’ theorem finds P(A|B) when you know P(B|A) and the prior P(A): P(A|B) = P(B|A) · P(A) ÷ P(B). The bottom is found by adding the ways B can happen: P(B) = P(B|A) · P(A) + P(B|not A) · P(not A).
Why can a positive result still leave a low probability?
When the prior is small, most of the B-positive people come from the large group without A. With a prior of 1%, a sensitivity of 90% and a false positive rate of 5%, only 9 of the 58.5 B-positive people in 1,000 have A, which is 15.38%. This is an illustration of the arithmetic, not medical advice.
How do I know if two events are independent?
Events are independent when P(A|B) equals P(A): knowing B tells you nothing about A. The calculator compares the two numbers when you enter P(A). For the chance of two independent events both happening, use the probability calculator.
Can conditional probability be zero?
Yes. P(A|B) is 0 when A and B can never happen together, because the top of the fraction, P(A and B), is 0 while P(B) is positive. That is different from “undefined”, which happens only when P(B) itself is 0.
What is the difference between conditional and joint probability?
The joint probability P(A and B) is the chance that both events happen out of all outcomes. The conditional probability P(A|B) rescales that chance to the cases where B happened. In the exam table the joint probability is 80 ÷ 200 = 0.4, and the conditional probability is 80 ÷ 100 = 0.8.
Are mutually exclusive events independent?
No, not when both have a positive chance. If A and B cannot happen together, then P(A|B) = 0, which is different from P(A), so knowing B changes the chance of A. The probability calculator covers mutually exclusive events in detail.
How does drawing without replacement change the probability?
Each draw changes what is left, so later draws depend on earlier ones. The chance that the second card is a king, given that the first card was a king, is 3 ÷ 51 = 1 ÷ 17 = 0.0588, not 4 ÷ 52. For many draws from a group with a known number of successes, use the hypergeometric calculator.
How do I calculate conditional probability in Excel or on a TI-84?
Neither has a built-in command. In Excel or Google Sheets divide the two cells: =B2/B3, or =IF(B3=0,”undefined”,B2/B3) to avoid a divide-by-zero error. On a TI-83 or TI-84, type P(A and B)/P(B) on the home screen and press ENTER.
Easy Stat Calc · Results checked against Python, R and Excel · Last updated November 6, 2026 · Methodology