
Find the mean, median and mode of your numbers side by side, with the sorted list, the middle value marked and the working for each.
Loading calculator…
This free mean median mode calculator is also a median calculator and a mean and median calculator in one. Paste a list of numbers and it returns the three averages, plus the count, sum, minimum, maximum and range, then shows how each one was found. If you only need the middle value, it works as a median finder too. It also accepts a frequency table, when your data comes as a value plus a count.
Most people trust a single average, but the three answers can differ a lot once the data is skewed, such as a list of salaries with one very high pay. The mean, median and mode each name a typical value, and the wrong one can make a summary misleading. Seeing all three together shows which one fits your data.
How to use this mean median mode calculator
- Enter your numbers in the box, separated by commas, spaces or line breaks. You can paste a column or a row straight from spreadsheets such as Excel or Google Sheets, or from a text document.
- Press Calculate. The mean, median and mode appear in three boxes at the top, followed by the count, sum, minimum, maximum and range.
- Read the working. The sorted list marks the middle value used for the median, the mean is shown as the sum divided by the count, and the mode section lists the values that repeat and how often.
- Check the note and the dot plot. They show whether the mean is higher or lower than the median and where both sit among your data, with a plain-language interpretation.
Text such as names or units is skipped and listed under the result, so you can see exactly which numbers were used. The tool also handles the edge cases: a single value, two values, negatives, decimals, a list where every value is the same, and ties for the mode. Four example buttons fill in sample data: an odd count, an even count, a data set with two modes and a set of salaries with one very large value.
Frequency table mode
If your data already comes as a value and a count, such as survey results or shoe sizes, press Frequency table above the data box and type one pair per line: the value, a colon and how many times it appears, for example 8:9 (the value 8 appears 9 times). A space or a comma between the two numbers also works, and the same value on two lines is added together. There is no need to type every repeat, and a table with a million entries is as quick as one with five.
In this mode the calculator adds a table with the frequency, frequency times value and the cumulative frequency, and marks the row that holds the median. Two example buttons, shoe sizes and dice rolls, fill in sample tables. Class intervals (ranges such as 10 to 20) are not accepted; enter each value on its own line.
What are mean, median and mode?
Mean, median and mode are the three measures of central tendency. They reduce a data set to one central value, and they are the first step in descriptive statistics.
- Mean (x̄): the arithmetic average. Add all the values and divide by how many there are.
- Median: the middle value when the numbers are sorted from smallest to largest.
- Mode: the value that appears most often. A data set can have one mode, several modes or none.
Range is not an average but is often taught with them: it is the largest value minus the smallest, and it shows how spread out the numbers are.
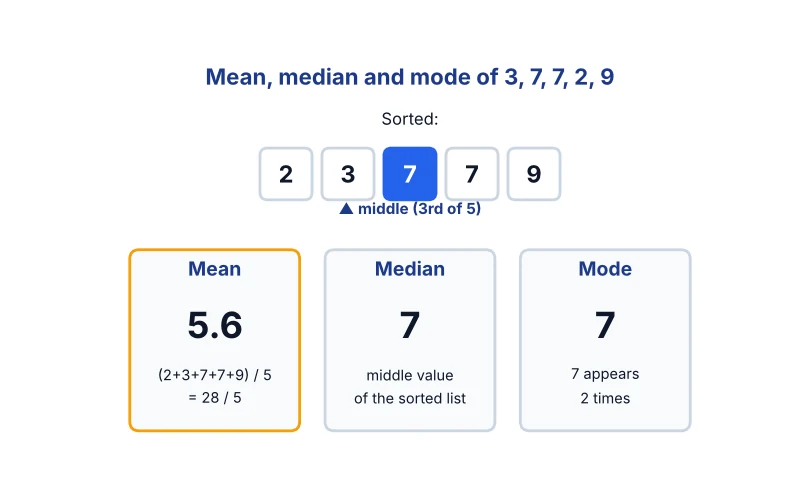
Example: for 3, 7, 7, 2 and 9, the sorted list is 2, 3, 7, 7, 9. The mean is (2 + 3 + 7 + 7 + 9) / 5 = 28 / 5 = 5.6. The median is the 3rd of 5 values, 7. The mode is 7, because it appears twice. The range is 9 − 2 = 7.
How to find the median
To find the median, sort the numbers from smallest to largest and take the middle one. How you find the middle depends on whether the count, n, is odd or even:
- Odd count: the median is the value in position (n + 1) / 2. For 40, 42, 47, 53, 54, 59, 65 there are 7 values, so the median is the 4th value, 53.
- Even count: there are two middle values, in positions n / 2 and n / 2 + 1. The median is their average. For 3, 4, 5, 6, 8, 9 the 3rd and 4th values are 5 and 6, so the median is (5 + 6) / 2 = 5.5.

The most common mistake is to skip the sorting step and take the middle of the list as it was typed. The calculator always sorts first and shows the sorted list, so you can check the position of the median yourself. Repeated values stay in the list: in 2, 3, 7, 7, 9 both 7s count.
How to find the mean and the mode
Mean: add every value and divide the total by the count. For 40, 42, 47, 53, 54, 59 and 65 the sum is 360 and the count is 7, so the mean is 360 / 7 = 51.4286. For a row-by-row running total, use the mean tool.
Mode: count how often each value appears and pick the one that appears most. In 3, 7, 7, 2, 9 the mode is 7. If two values tie, as in 1, 2, 2, 3, 3, 4, both are modes and the data is bimodal (modes 2 and 3). If no value repeats, as in 40, 42, 47, 53, 54, 59, 65, there is no mode. The mode depends on frequency, not on size, which makes it the only one of the three you can use for words or categories, such as the most common shirt size or favorite color. To list every mode, count words or work with grouped data, use the mode calculator.
Mean vs median vs mode: the difference
The three measures react differently to extreme values. The mean uses every number, so one outlier moves it. The median depends only on the middle of the sorted list, so it barely moves. The mode ignores size altogether.
| Row label | Mean | Median | Mode |
|---|---|---|---|
| What it is | Sum divided by count | Middle of the sorted data | Most frequent value |
| Affected by an outlier? | Strongly | Barely | No |
| Best for | Symmetric data | Skewed data | Categories and common values |
| Example use | Average exam score | Median household income | Most common shoe size |
| Always exists? | Yes | Yes | No (a data set can have no mode) |

Six salaries of $32k, $35k, $38k, $40k, $41k and $250k have a median of $39,000 but a mean of $72,667. Five of the six people earn less than the mean, so the median describes a typical salary much better. The calculator compares the two for your data: if the mean is higher than the median, large values pull it up; if it is lower, small values pull it down.
When to use the mean, the median or the mode
- Use the mean for symmetric data with no extreme values, such as test scores, heights or daily temperatures. It uses every value.
- Use the median for skewed data, such as income, house prices or reaction times, where a few very large values distort the average. The U.S. Census Bureau reports median household income for this reason.
- Use the mode for categorical data, such as survey answers, colors or sizes, and whenever you want the most common value.
To measure the spread as well as the center, use the standard deviation tool, the MAD tool for the average distance from the mean ,or the all-in-one statistics calculator for a full summary of your data.
How mean, median and mode relate to the shape of the data
- Symmetric data (a bell curve): one peak in the middle, so mean = median = mode, or very close to it. Heights and IQ scores are close to this.
- Right-skewed data: a long tail of high values, so the order is mode < median < mean. Salaries, house prices and waiting times are examples.
- Left-skewed data: a long tail of low values, so the order is mean < median < mode. Age at retirement is an example.
The gap between the mean and the median is a quick check for skew: the wider it is, the more the data is stretched to one side. A data set with two peaks (bimodal) has two modes, and neither the mean nor the median describes it well on its own.
Mean, median and mode from a frequency table
| Shoe size (value) | Frequency | Frequency × value | Cumulative frequency |
|---|---|---|---|
| 6 | 3 | 18 | 3 |
| 7 | 5 | 35 | 8 |
| 8 ▲ middle | 9 | 72 | 17 |
| 9 | 4 | 36 | 21 |
| 10 | 2 | 20 | 23 |
The total count is 3 + 5 + 9 + 4 + 2 = 23, and the sum of the frequency × value column is 181. Mean: 181 / 23 = 7.8696. Median: n = 23 is odd, so the median is the (23 + 1) / 2 = 12th value. The cumulative frequency is 8 at size 7 and reaches 17 at size 8, so the 9th to 17th values are all 8, and the median is 8. Mode: size 8 has the highest frequency, 9, so the mode is 8.
Because the mean (7.8696) is slightly lower than the median (8), a few small sizes pull it down a little.
Mean, median and mode in Excel and on a TI-84
With the data in cells A1 to A7 of Excel or Google Sheets, these formulas give the same results as the calculator:
| You want | Excel / Google Sheets | TI-83/84 |
|---|---|---|
| Mean | =AVERAGE(A1:A7) | STAT, CALC, 1-Var Stats: x̄ |
| Median | =MEDIAN(A1:A7) | 1-Var Stats: scroll down to Med |
| Mode | =MODE.MULT(A1:A7) | no mode key: sort with SortA( and look for repeats |
| Range | =MAX(A1:A7)-MIN(A1:A7) | 1-Var Stats: maxX – minX |
=MODE.MULT returns every mode when there is a tie. The older =MODE returns only the first one, and both return #N/A when no value repeats. On the TI-84, enter the data in L1 with STAT, EDIT before you run 1-Var Stats. For a frequency table, put the values in L1 and the frequencies in L2 and run 1-Var Stats L1,L2. In Excel the mean of a frequency table is =SUMPRODUCT(A1:A5,B1:B5)/SUM(B1:B5).
Mean median mode calculator FAQs
What is the difference between mean, median and mode?
All three describe the center of a data set in a different way. The mean is the sum divided by the count, the median is the middle value of the sorted data, and the mode is the value that appears most often. The mean reacts most to extreme values, the median barely moves, and the mode ignores how large the values are.
How do you find the mean?
Add all the values, then divide the total by how many values there are: x̄ = Σx / n. For 4, 8, 6, 5 and 3 the sum is 26 and the count is 5, so the mean is 26 / 5 = 5.2. Negatives and decimals work the same way.
How do you find the median with an even number of values?
Sort the data, find the two middle values in positions n / 2 and n / 2 + 1, and average them. For 3, 4, 5, 6, 8 and 9 the middle values are 5 and 6, so the median is (5 + 6) / 2 = 5.5. With an odd count there is one middle value and nothing to average.
Can a data set have two modes or no mode?
Yes. If two values tie for most frequent, the data is bimodal (modes 2 and 3 in 1, 2, 2, 3, 3, 4), and with three or more tied values it is multimodal. If no value repeats, there is no mode. When every value appears the same number of times, such as 1, 1, 2, 2, 3, 3, many teachers also say there is no mode; the calculator lists the tied values and adds a note.
When should the median be used instead of the mean?
Use the median when the data is skewed or has outliers, such as incomes or house prices, because a few extreme values drag the mean up or down while the median stays near the middle. One person earning $200,000 and five earning $30,000 gives a mean of about $58,333 but a median of $30,000, and the median describes the typical person better.
Can the mean and median be equal?
Yes. In a symmetric data set, such as a bell-shaped distribution of heights, the mean and median are equal or nearly equal, and in a perfect normal distribution the mode is the same value too. A clear gap between the mean and the median is a sign of skew.
What are the mean, median and mode of 13, 16, 12, 14, 19, 12, 14, 13, 14?
Sorted, the list is 12, 12, 13, 13, 14, 14, 14, 16, 19. The sum is 127 and the count is 9, so the mean is 127 / 9 = 14.1111. The median is the 5th value, 14. The mode is 14, which appears 3 times. The range is 19 − 12 = 7.
Can I enter a frequency table or grouped data?
You can enter a frequency table: switch to “Frequency table” and type one pair per line, the value and how many times it occurs, such as 8:9. The calculator finds the mean, median and mode without typing every repeat. It does not accept class intervals (ranges such as 10 to 20); use each class midpoint as the value if you only need an estimate.
How do you find the mean, median and mode from a frequency table?
Mean: multiply each value by its frequency, add the products and divide by the total count. Median: add the frequencies into a running total (cumulative frequency) and find the value that holds the middle position. Mode: the value with the highest frequency. For shoe sizes 6, 7, 8, 9, 10 with frequencies 3, 5, 9, 4, 2 the total is 23, the mean is 181 / 23 = 7.8696, the median is the 12th value, 8, and the mode is 8.
Easy Stat Calc · Results checked against Python, R and Excel · Last updated November 1, 2026 · Methodology