
Find the chance of exactly, at most or at least k events when you know the average rate, with every step shown and the same answer in Excel and on a TI-84.
Loading calculator…
This free Poisson distribution calculator, also called a Poisson calculator or a Poisson probability solver, turns an average rate into the probability of exactly k, at most k, fewer than k, at least k or more than k events, or of a count between a and b.
How to use this Poisson calculator
- Choose what you know. Enter the average number of events in the interval (λ), or a rate and a length. A rate and a length are multiplied: 3 calls per hour for 2 hours gives λ = 6.
- Choose the question (exactly, at most, fewer than, at least, more than, or between a and b) and enter k as a whole number. For “between”, enter a and b; both ends are included.
- Press Calculate. You get the answer as a decimal and a percent, all five probabilities side by side, the summary statistics, the working with your numbers, a shaded bar chart, and the matching Excel and TI-83/84 commands.
Three example buttons fill in the numbers for you. If you only have counts from past intervals, find their average first with the mean tool and use it as λ. Not sure this is the right distribution? The probability and distribution calculators page helps you choose. If you have your own table of outcomes and probabilities instead of a steady rate, use the distribution table calculator.
What is a Poisson distribution?
A Poisson distribution (also called the Poisson probability distribution) gives the probability of each possible number of events (0, 1, 2, 3 and so on) in a fixed interval of time, distance or area, when the events happen independently at a constant average rate. Examples are calls per hour or typing errors per page. It has one parameter, λ (lambda), the average number of events per interval.
A situation is a Poisson experiment when these four assumptions hold: events happen at a known, constant average rate; they are independent, so one event does not change the chance of the next; two events cannot happen at exactly the same instant; and the chance of an event is proportional to the length of the interval.
What does it look like? For a small λ the bars pile up on the left with a long right tail. From about λ = 10 the shape looks like a bell curve.
Poisson distribution formula
The probability of exactly x events, the PMF, is:
P(X = x) = e−λ × λx / x!

Here e ≈ 2.71828 and x! is x factorial. The mean is λ, the variance is λ and the standard deviation is √λ, so doubling the rate multiplies the spread by about 1.41. The skewness is 1/√λ and the excess kurtosis is 1/λ.
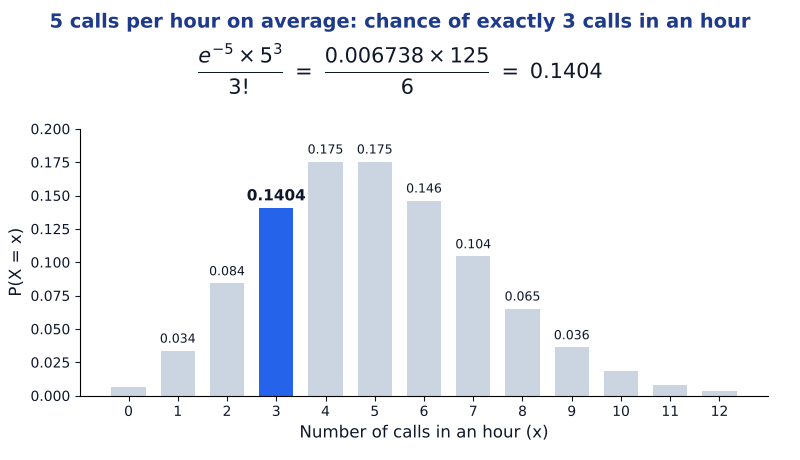
Example: a help desk gets 5 calls per hour on average. The chance of exactly 3 calls in an hour is e−5 × 53 / 3! = 0.006738 × 125 / 6 = 0.1404, about 14%.
Exactly, at most, at least: cumulative Poisson probability
Questions about a threshold need a running total, the cumulative distribution function (CDF). This Poisson CDF calculator adds the exact probabilities from 0 up to the cutoff:
| You want | Symbol | How it is found |
|---|---|---|
| Exactly x | P(X = x) | the formula above |
| At most x (x or fewer) | P(X ≤ x) | P(0) + P(1) + … + P(x) |
| Fewer than x | P(X < x) | P(X ≤ x − 1) |
| At least x (x or more) | P(X ≥ x) | 1 − P(X ≤ x − 1) |
| More than x | P(X > x) | 1 − P(X ≤ x) |
| Between a and b | P(a ≤ X ≤ b) | P(X ≤ b) − P(X ≤ a − 1) |
Example with λ = 4 and x = 2: P(X = 2) = 0.1465, P(X ≤ 2) = 0.2381, P(X < 2) = 0.0916, P(X ≥ 2) = 0.9084 and P(X > 2) = 0.7619. “Fewer than 2” and “at least 2” add up to 1.
Poisson distribution example with a rate and a length
A help desk gets 3 calls per hour on average. What is the chance of exactly 8 calls in 2 hours? The rate must match the interval, so λ = 3 × 2 = 6, and P(X = 8) = e−6 × 68 / 8! = 0.1033, about 10.3%. For at least 10 calls in the same 2 hours, P(X ≥ 10) = 1 − P(X ≤ 9) = 1 − 0.9161 = 0.0839, about 8.4%.
Always use the same interval for λ and for x.
When to use the Poisson distribution, and when not to
Use it for counts of independent events in a fixed interval when the average rate is steady. Poisson vs binomial: a binomial distribution has a fixed number of trials n, each with probability p, while a Poisson count has no fixed number of trials. When n is large and p is small, the binomial is close to a Poisson with λ = np; a common rule of thumb is n of at least 20 and p of at most 0.05. When you draw from a small fixed group without putting items back, use the hypergeometric tool instead.
When λ is about 10 or more, the shape is close to a normal distribution with mean λ and standard deviation √λ, so a z-score and the normal z table give a rough answer. For spread in a data set, use the standard deviation tool.
Do not use it when the rate changes (customers per hour through a day), when events cluster or infect one another (epidemics), or when the variance is clearly larger than the mean. Counts that spread wider than their mean are called overdispersed, and a negative binomial model usually fits them better.
Where the Poisson distribution is used
Call centers use it to plan staffing, hospitals to plan emergency room admissions, websites to size servers and factories to count defects per batch. Insurers use it for claims per week.
For the chance of one event, two events together or repeated tries, use the basic probability calculator.
Poisson distribution in Excel, Python and R
The examples use λ = 4 and x = 2 and match the results above:
| Question | Excel | Python (SciPy) | R | TI-83/84 |
|---|---|---|---|---|
| P(X = 2) | =POISSON.DIST(2, 4, FALSE) | poisson.pmf(2, 4) | dpois(2, 4) | poissonpdf(4, 2) |
| P(X ≤ 2) | =POISSON.DIST(2, 4, TRUE) | poisson.cdf(2, 4) | ppois(2, 4) | poissoncdf(4, 2) |
| P(X ≥ 2) | =1-POISSON.DIST(1, 4, TRUE) | poisson.sf(1, 4) | ppois(1, 4, lower.tail = FALSE) | 1 – poissoncdf(4, 1) |
| P(X > 2) | =1-POISSON.DIST(2, 4, TRUE) | poisson.sf(2, 4) | ppois(2, 4, lower.tail = FALSE) | 1 – poissoncdf(4, 2) |
Poisson distribution calculator FAQs
Is the Poisson distribution discrete or continuous?
It is discrete. A Poisson random variable counts events, so it can only be 0, 1, 2, 3 and so on, never a fraction or a negative number. The average rate λ, however, can be any positive number, such as 2.5 calls per hour.
Can λ be a decimal?
Yes. λ is an average, so 0.4 typing errors per page or 2.5 calls per hour are fine. The count x you ask about must be a whole number.
How do I calculate “at least” in a Poisson distribution?
Subtract the chance of fewer events from 1: P(X ≥ x) = 1 − P(X ≤ x − 1). With λ = 4 and x = 2, P(X ≥ 2) = 1 − 0.0916 = 0.9084. In Excel, type =1-POISSON.DIST(1, 4, TRUE).
What is the difference between the PMF and the CDF?
The PMF gives the probability of one exact count, P(X = x). The CDF adds the PMF values from 0 up to x, so it gives “at most x”, P(X ≤ x). Excel’s POISSON.DIST uses FALSE for the PMF and TRUE for the CDF.
Why are the mean and variance of a Poisson distribution both λ?
Both equal λ because the single parameter λ controls the whole distribution. The standard deviation is therefore √λ. If real counts vary much more than their mean, the Poisson model is a poor fit.
Easy Stat Calc · Results checked against R, Python and Excel · Last updated November 6, 2026 · Methodology