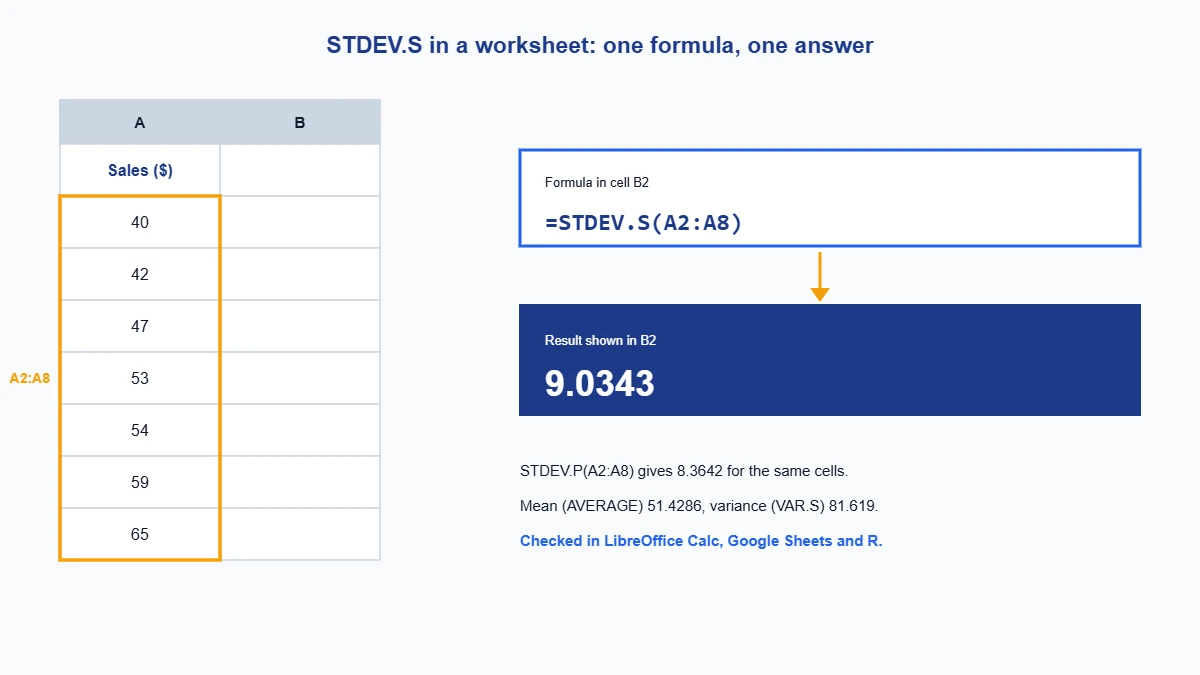
To find standard deviation in Excel, type =STDEV.S(A2:A8) if your cells are a sample, or =STDEV.P(A2:A8) if they hold every value in the group. For the numbers 40, 42, 47, 53, 54, 59 and 65 the first formula returns 9.0343 and the second 8.3642.
We wrote this guide after running every formula below in LibreOffice Calc (which reads Excel function names) and in Google Sheets, and checking each answer against R. The numbers you see are the numbers we got. If you would rather skip the spreadsheet, our free standard deviation calculator gives the same results with the working shown.
How to calculate standard deviation in Excel
We use seven daily sales figures in dollars, typed into cells A2 to A8 with the heading “Sales” in A1: 40, 42, 47, 53, 54, 59 and 65. The steps use functions that exist in current versions of Excel and in LibreOffice Calc.
- Type your data in one column. Put one number in each cell, with no text or totals inside the range.
- Click an empty cell, for example B2, where the answer should appear.
- Type the formula. Enter
=STDEV.S(, select the cells A2 to A8 with the mouse, then close the bracket so it reads=STDEV.S(A2:A8). - Press Enter. Excel shows 9.0343 (you can raise or lower the decimals with the Home tab buttons).
- Need the whole-population figure? Use
=STDEV.P(A2:A8)instead. It returns 8.3642.
The mean is =AVERAGE(A2:A8), which gives 51.4286. A common way to report the result is “mean ± standard deviation”, here 51.43 ± 9.03. Our mean calculator shows the same average with its steps.
If you prefer menus to typing, open the Formulas tab and choose Insert Function (fx). Pick STDEV.S in the Statistical category, click OK and select A2:A8 in the Number1 box. Excel then writes the same formula for you.
Which standard deviation to use in Excel: STDEV.S or STDEV.P
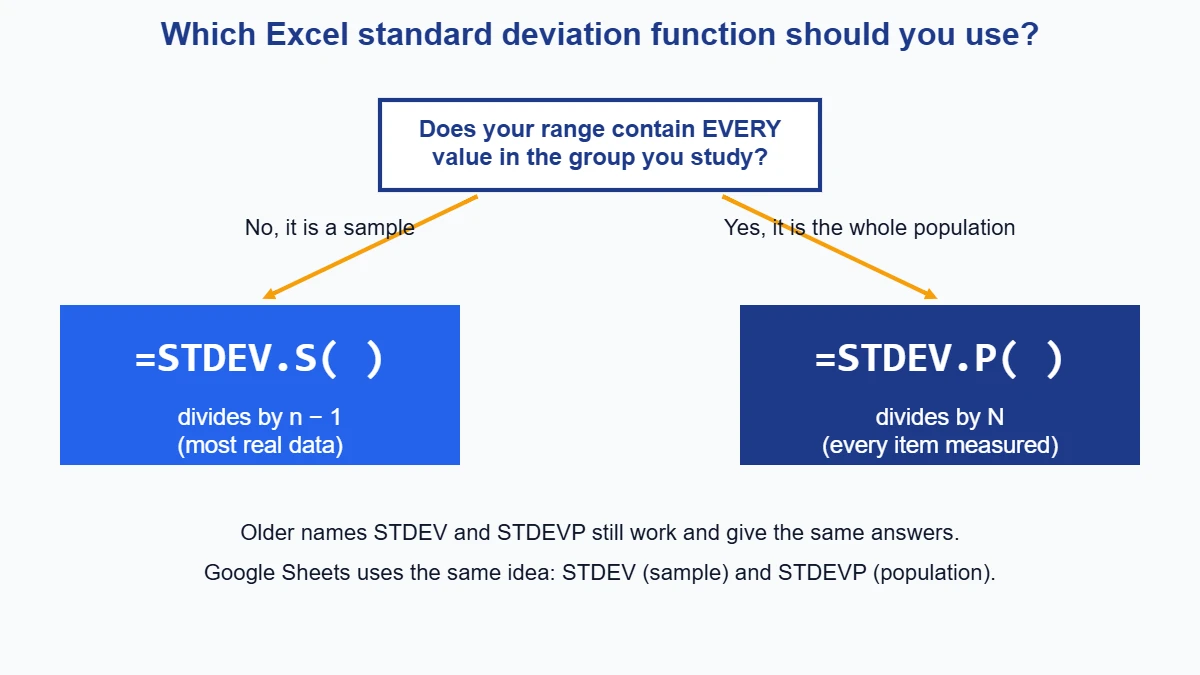
STDEV.S vs STDEV.P comes down to one thing, the divisor. STDEV.S divides by n − 1 and is meant for a sample, a smaller group drawn from a bigger one. STDEV.P divides by N and is meant for a population, where your cells are every single item you care about. Most real worksheets hold a sample, so STDEV.S is the safe default. The gap is bigger with small data sets: with our seven values it is 9.0343 against 8.3642.
| Function | What it does | Text and blank cells in the range | Our result for 40, 42, 47, 53, 54, 59, 65 |
|---|---|---|---|
| STDEV.S | Sample standard deviation (n − 1) | Ignored | 9.0343 |
| STDEV.P | Population standard deviation (N) | Ignored | 8.3642 |
| STDEV | Older name, same as STDEV.S | Ignored | 9.0343 |
| STDEVP | Older name, same as STDEV.P | Ignored | 8.3642 |
| STDEVA | Sample SD that counts text as 0 and TRUE as 1 | Counted | 9.0343 (no text here) |
| STDEVPA | Population SD that counts text as 0 and TRUE as 1 | Counted | 8.3642 (no text here) |
The older names are kept so that old files keep working, so new worksheets should use the dotted versions. If you are unsure which divisor your teacher or report expects, use the sample version. For a quick answer to both, the sample standard deviation calculator shows sample and population results side by side.
Check Excel’s answer by hand
We like to confirm a formula once by hand, because then the result stops feeling like magic. The standard deviation is simply the root of the variance, and the variance is the average squared distance from the mean.
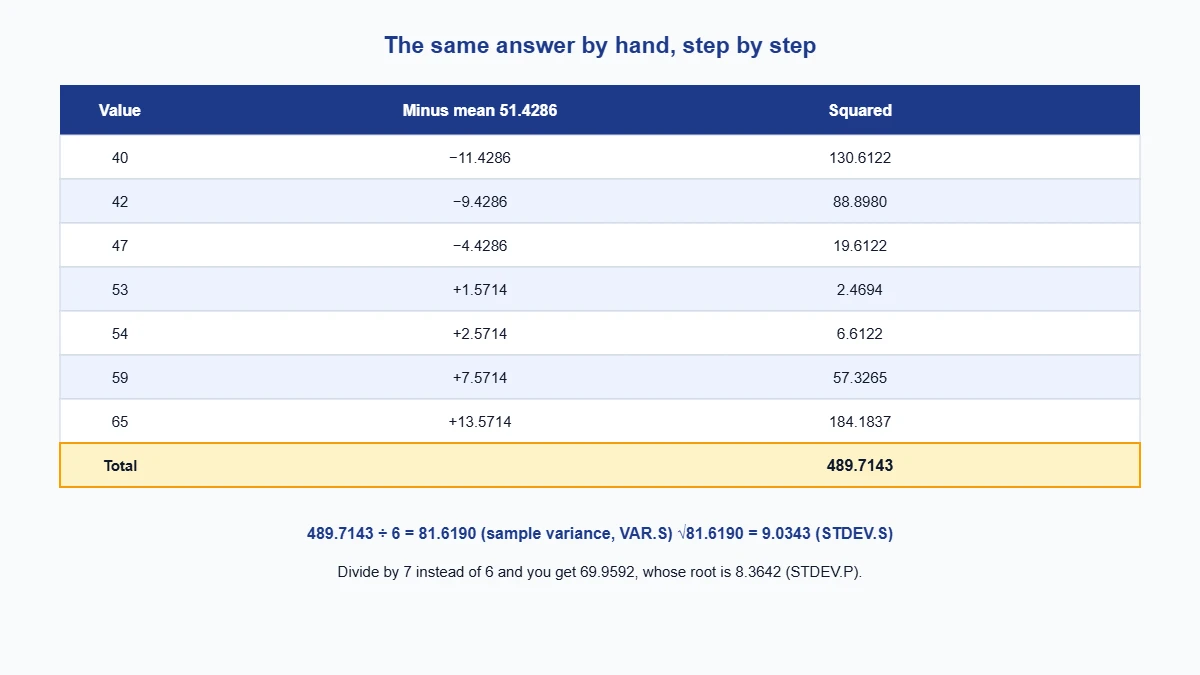
- Find the mean: 360 ÷ 7 = 51.4286.
- Square every gap between a value and the mean. Added together, the squared gaps come to 489.7143, the same total that
=DEVSQ(A2:A8)returns in one cell. - Divide by n − 1 = 6 to get the sample variance 81.619, which is
=VAR.S(A2:A8). - Take the square root: √81.619 = 9.0343.
Divide by 7 instead and you get the population variance 69.9592 (=VAR.P) and a standard deviation of 8.3642. Our variance calculator shows this table for any numbers you paste in.
What does 9.03 mean for our sales figures?
It says a typical daily sale sits about $9 away from the average of about $51. In our list, 4 of the 7 values fall within one standard deviation of the mean (between 42.39 and 60.46) and 3 fall outside, which is about what you would expect from a small, roughly even spread.
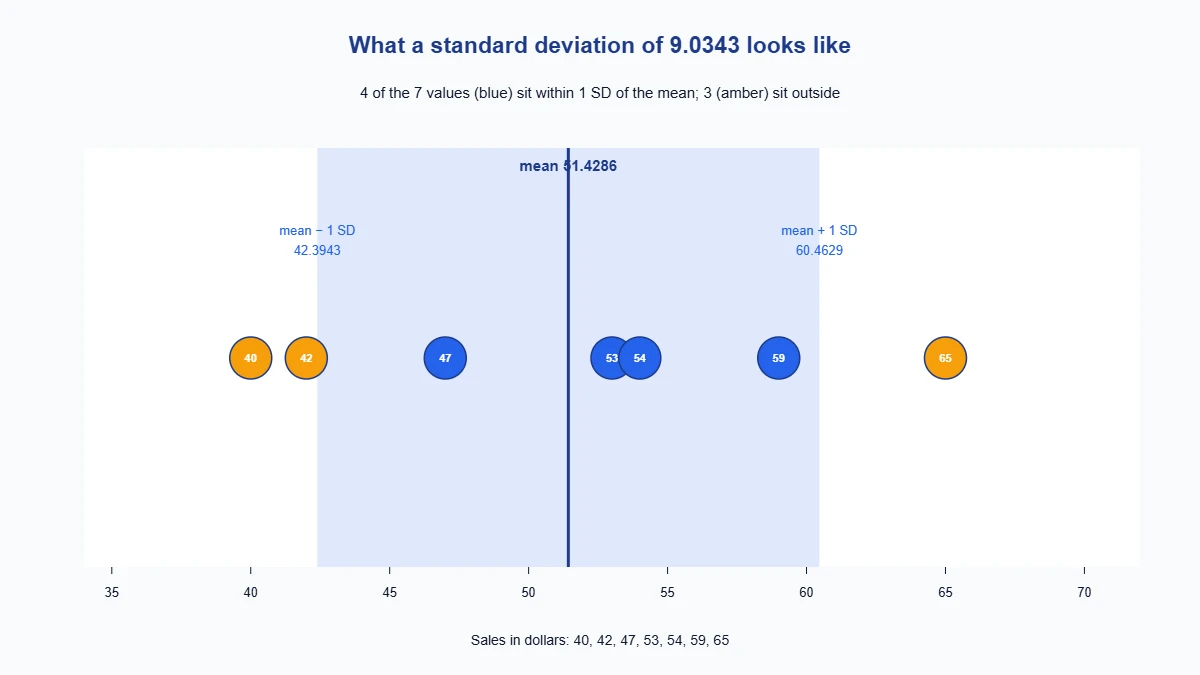
A standard deviation only means something next to the mean. A value of 9 is large for numbers around 20 and tiny for numbers around 2,000. To compare spread across datasets with different units, divide by the mean: =STDEV.S(A2:A8)/AVERAGE(A2:A8) gives 0.1757, or 17.57%, which is the coefficient of variation. When you want it as a percentage, multiply by 100: =STDEV.S(A2:A8)/AVERAGE(A2:A8)*100 returns 17.57, the relative standard deviation (RSD). Our coefficient of variation calculator does this directly, while the standard deviation graph plots a bell curve from your mean and spread.
Standard deviation for part of your data
Suppose the first four days were the morning shift (40, 42, 47, 53) and the last three the evening shift (54, 59, 65). Point the formula at each block: =STDEV.S(A2:A5) gives 5.8023 and =STDEV.S(A6:A8) gives 5.5076. The means are 45.5 and 59.3333, so the evening shift sold more, with a similar spread.
When the shift name sits in column B, you can pick rows by a condition. Excel has no “STDEVIF” function, but an array formula does the job: =STDEV.S(IF(B2:B8="Morning",A2:A8)). In older Excel versions confirm it with Ctrl+Shift+Enter; in current Excel just press Enter. We ran this in LibreOffice Calc on our seven values and got 5.8023 for Morning and 5.5076 for Evening, the same as R.
Mean and standard deviation together in Excel
The two numbers usually travel together. To find the mean in Excel, type =AVERAGE(A2:A8), which returns 51.4286 for our sales figures, and put =STDEV.S(A2:A8) in the next cell for the spread, 9.0343. Report them as one line, for example “mean 51.43, standard deviation 9.03”. Both functions ignore text and blank cells, so they always use the same numbers. If you do not need the working, our mean calculator gives the average from pasted data in one step.
Standard error in Excel
Standard error, also called the standard error of the mean (SEM), is the standard deviation divided by the square root of the number of values, so it measures how precisely the mean is known, while the standard deviation describes how spread out the data are. In Excel, type =STDEV.S(A2:A8)/SQRT(COUNT(A2:A8)). For our data that is 9.0343 ÷ √7 = 3.4147. Use COUNT rather than typing 7 so that the formula keeps working when you add rows.
Show standard deviation as error bars in an Excel chart
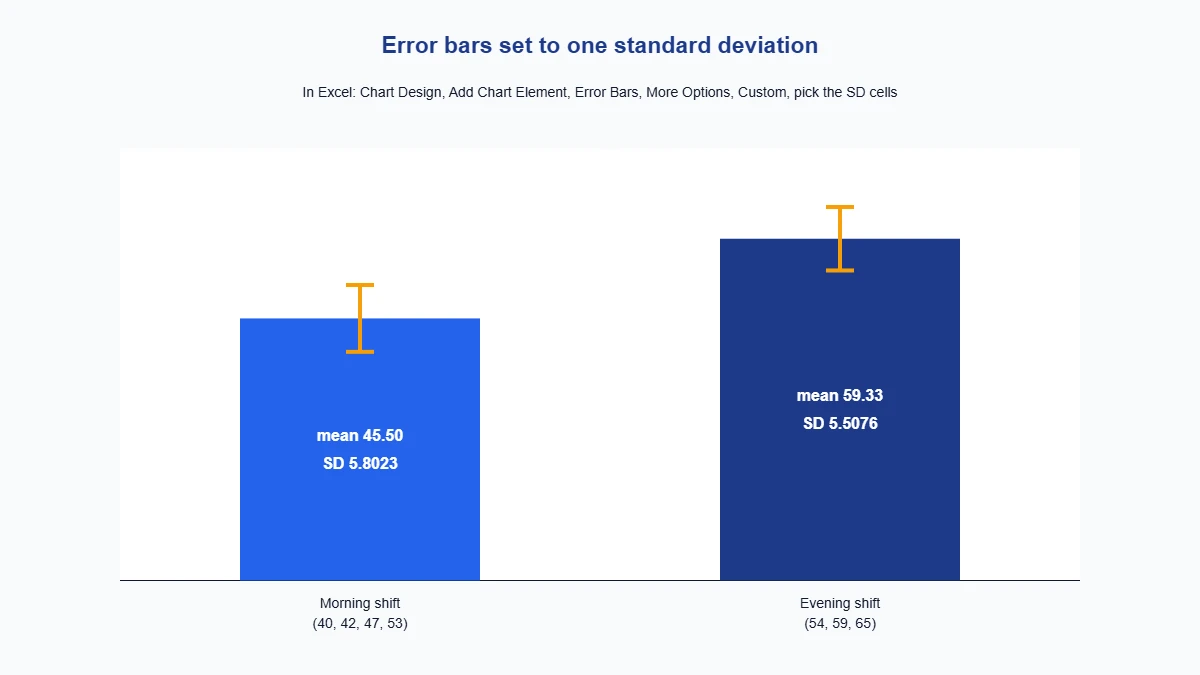
- Put the group names in one column and their means in the next (
=AVERAGE), with their standard deviations (=STDEV.S) beside them. - Select the names and means and insert a column chart.
- With the chart selected, choose Chart Design, Add Chart Element, Error Bars, More Error Bars Options.
- Pick Custom, click Specify Value, and select the standard deviation cells for both the plus and minus values.
Label the bars in your report so readers know the whiskers show one standard deviation, not the standard error, which is much shorter.
Common errors and how to fix them
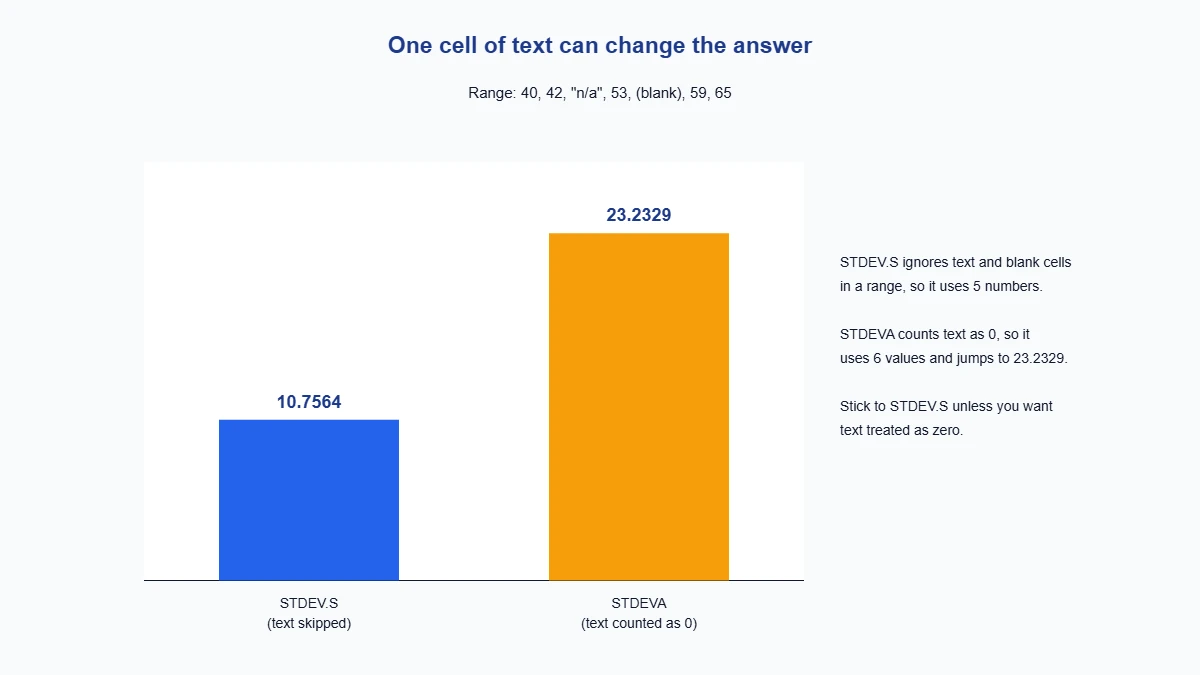
- #DIV/0! error. STDEV.S needs at least two numbers. With one number, the sample standard deviation does not exist (R also returns NA).
- Text or blank cells. STDEV.S skips them. For the range 40, 42, “n/a”, 53, (blank), 59, 65 it returns 10.7564 using five numbers, while STDEVA counts the text as 0 and returns 23.2329.
- Numbers stored as text. Values that Excel left-aligns, or that show a green corner, are text and get ignored. Convert them with Data, Text to Columns, or multiply the column by 1.
- Totals inside the range. If A9 holds a sum or average, include only A2:A8 or the total will distort the result.
Standard deviation in Google Sheets
Google Sheets follows the same pattern. =STDEV(A2:A8) is the sample standard deviation and =STDEVP(A2:A8) is the population one. Sheets also accepts STDEV.S and STDEV.P. The chart error bars live under Customize, Series, Error bars. We ran all of them in Google Sheets on our seven values and got 9.0343 and 8.3642 (STDEV and STDEVP, and the same for STDEV.S and STDEV.P). Text and blank cells behave as in Excel: STDEV.S on our text example returns 10.7564, and STDEVA returns 23.2329. You can check any answer against our standard deviation tool.
Standard deviation in R
In R the function sd() is the sample standard deviation, so sd(c(40,42,47,53,54,59,65)) returns 9.0343. For the population version, average the squared gaps yourself: sqrt(mean((x - mean(x))^2)), which returns 8.3642. We ran both in R 4.6.1 to check this guide.
Frequently asked questions
What is the formula for standard deviation in Excel?
Use =STDEV.S(range) for a sample and =STDEV.P(range) for a whole population, for example =STDEV.S(A2:A8).
Which standard deviation should I use in Excel, STDEV.S or STDEV.P?
Use STDEV.S unless your cells hold every item in the group. Most worksheets contain a sample, and STDEV.S divides by n − 1 to correct for that.
Is STDEV the same as STDEV.S?
Yes, they return identical numbers. STDEV is the pre-2010 name that Excel keeps so old workbooks still open correctly; choose STDEV.S in anything you build now.
Which formulas give both the average and the spread?
Use =AVERAGE for the centre and =STDEV.S for the spread, both pointed at A2:A8. Our sales column gives 51.4286 and 9.0343.
Can I get standard deviation if I only have the variance?
Yes. Wrap the variance in a square root, as in =SQRT(VAR.S(A2:A8)), which turns 81.619 back into 9.0343.
Why does STDEV.S return a #DIV/0! error?
The range holds fewer than two numbers. A sample standard deviation needs at least two values, because it divides by n − 1.
Can I calculate standard deviation in Excel without a formula?
Yes. The Data Analysis ToolPak (Descriptive Statistics) lists it, and our standard deviation calculator accepts pasted columns and shows the steps.
How do I add standard deviation bars to an Excel chart?
Select the chart, choose Add Chart Element, Error Bars, More Options, Custom, and point both the plus and minus values at your standard deviation cells.
How do I calculate standard deviation in Google Sheets?
Use =STDEV(A2:A8) for a sample or =STDEVP(A2:A8) for a population.
How large is a large standard deviation?
It depends on the scale of the data. Set it beside the mean, or use the coefficient of variation, before you decide that the spread is large.
Want to test your own numbers? Drop them into the standard deviation calculator, or browse the descriptive statistics calculators. How we test our numbers is explained on the methodology page.
Easy Stat Calc · Checked against R and Excel · Last updated November 16, 2026 · Methodology