
Paste your numbers, or enter an SD and n, to find the standard error.
Loading calculator…
This free standard error calculator, also called a SEM calculator or standard error of the mean calculator, gives you the standard error step by step. Paste raw data with line breaks, commas or spaces, or enter summary data (the sample standard deviation and sample size). You get a precise estimate of how much the sample mean could change from sample to sample, with the formula written out in your own numbers. For the spread of the raw data, try the standard deviation calculator.
How to use this standard error calculator
- Choose your inputs. Pick Data list for a set of numbers, or SD and sample size for summary inputs.
- Enter your numbers. Paste values separated by line breaks, commas or spaces. Cells copied from a spreadsheet work too. For summary data, enter s and n; the mean is optional.
- Press Calculate. The standard error appears first, with the formula and your values filled in.
- Check the working. Leave Show working on to see each step, and use Reset to clear the fields and start again.
The list tab uses the sample standard deviation (dividing by n − 1), which is what a standard error of the mean needs. A Population switch is there for the rare case where your list is the whole population.
What is standard error?
Standard error measures how far a sample statistic is likely to land from the population parameter it estimates. The version most people need is the standard error of the mean (SEM, or just SE). Draw many different samples of the same size from one population and the sample mean will vary a little each time. The standard error is the typical size of that variation. A smaller SE means a more precise estimate of the true population mean; a larger SE means a rougher one.
It speaks to how steady your average is, not to how widely the individual values range. That second job belongs to the standard deviation.
Standard error formula
The standard error equation for the mean is short:
SE = s ÷ √n
Here s is the sample standard deviation and n counts the values. Textbooks that assume the population SD is known write the same standard error of the mean formula as σ ÷ √n. In both versions, a larger sample size makes the standard error smaller. The pieces behind s are:
- Mean: x̄ = Σx ÷ n
- Sample standard deviation: s = square root of [sum of (x − x̄)² ÷ (n − 1)]
- Degrees of freedom: df = n − 1
Two related formulas are worth knowing. The standard error of a proportion is √(p̂(1 − p̂) ÷ n), and a confidence interval is built as estimate ± critical value × SE. This page covers the standard error of the mean only.
How to calculate standard error: steps and worked example
To find the standard error from raw data, follow these steps. Take ten test scores: 72, 68, 75, 71, 80, 66, 74, 69, 77 and 73.

- Collect the data and count the values: n = 10.
- Find the mean: 725 ÷ 10 = 72.5.
- Find the sample standard deviation: s = 4.2492 (see every squared deviation in the step table).
- Take the square root of n: √10 = 3.1623.
- Divide: 4.2492 ÷ 3.1623 = 1.3437.
| Quantity | Symbol | Value |
|---|---|---|
| Sample size | n | 10 |
| Mean | x̄ | 72.5 |
| Sample standard deviation | s | 4.2492 |
| Square root of n | √n | 3.1623 |
| Standard error | SE | 1.3437 |
So the mean score of 72.5 would typically be about 1.34 away from the true mean of all such scores if you drew another sample of 10.
Standard error examples
Two more cases show how the formula works with different inputs.
Example 1: sum of squared deviations known. Take 4, 6, 9, 11 and 15, with an average of 9 and a total of 74 once you square each gap from 9 and add them up. Dividing 74 by n − 1 = 4 gives 18.5, so s = √18.5 = 4.3012. With n = 5, √n = 2.2361 and the standard error is 4.3012 ÷ 2.2361 = 1.9235.
Example 2: standard error from standard deviation (summary data only). A report gives s = 9.6 for n = 25. There are no raw values, so divide directly: 9.6 ÷ √25 = 9.6 ÷ 5 = 1.92. Use the SD and sample size tab for this.
Standard error vs standard deviation
People mix these up because the standard error is built from the standard deviation. They answer different questions.
| Standard deviation | Standard error | |
|---|---|---|
| Describes | The spread of the individual values | The precision of the sample mean |
| Formula | Square root of [sum of squared deviations ÷ (n − 1)] | s ÷ √n |
| Effect of a bigger sample | Stays about the same | Gets smaller |
| Use it to say | How much values vary | How closely the mean is pinned down |
Report the standard deviation when you want to describe your data and the standard error when you want to show how reliable the mean is. The standard error is never larger than the standard deviation once n is at least 2, and the two are not interchangeable with the variance, which is the squared spread.
How sample size changes the standard error
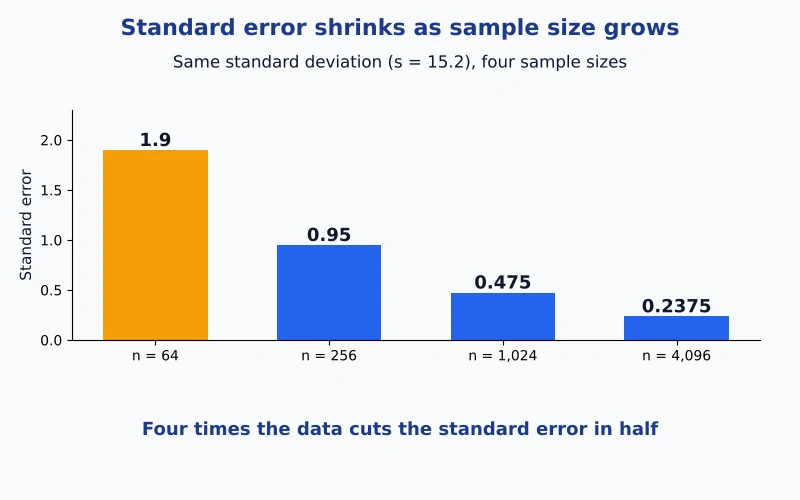
Because n sits under a square root, the gain from extra data slows down. The chart uses a fixed standard deviation of 15.2 and four sample sizes, each four times the last.
| Sample size n | √n | Standard error |
|---|---|---|
| 64 | 8 | 1.9 |
| 256 | 16 | 0.95 |
| 1,024 | 32 | 0.475 |
| 4,096 | 64 | 0.2375 |
Each fourfold increase in n halves the standard error. That is why a very large study can estimate a mean very precisely even when individual values vary a lot.
How to interpret standard error: what a small or large value means
A small standard error means repeated samples would give means that sit close together, so your sample mean is probably near the population mean. A large one means the estimate could move a lot from sample to sample. The usual causes of a large SE are a small sample and widely spread data. The standard error carries the same units as the data, so a result of 1.34 on a test scored in points is 1.34 points.
How to calculate standard error in Excel and Google Sheets
Excel has no single standard error function, but one formula does the job. Put your values in A2:A11 and type this in an empty cell:
=STDEV.S(A2:A11)/SQRT(COUNT(A2:A11))
- STDEV.S returns the sample standard deviation (4.2492 for the ten test scores).
- COUNT returns n (10), and SQRT turns it into √n (3.1623).
- Dividing the two gives the standard error, 1.3437, the same as the calculator.
In Google Sheets, type the identical formula in any cell. Switch to STDEV.P only when your list is the whole population. The calculator also writes this formula with your real cell range.
Standard error in Python, R and on a TI-84
| Tool | Formula or command | Note |
|---|---|---|
| Python | scipy.stats.sem(x) | Uses n − 1 by default |
| R | sd(x)/sqrt(length(x)) | No built-in SEM function in base R |
| TI-84 | STAT > CALC > 1-Var Stats, then Sx ÷ √n | Read Sx from the screen and divide |
All of these give the same answer as the calculator above.
Related calculators
The standard error is built from two other descriptive measures. Start with the mean calculator, then browse the descriptive statistics hub for more tools.
Standard error calculator FAQs
What is standard error?
Standard error is a measure of how much a sample statistic, such as the mean, would change from one sample to the next. For the mean, it equals s ÷ √n. A small value means your sample mean sits close to the true population mean.
Is standard error the same as SEM?
For a sample mean, yes. SEM stands for standard error of the mean, and people often shorten it to SE. The word “standard error” on its own can also refer to other statistics, such as a proportion, so SEM names the statistic being measured.
What is the standard error formula?
SE = s ÷ √n, where s is the sample standard deviation and n is the sample size. If the true population SD σ is known, the same idea is written σ ÷ √n. In both versions, more data means a smaller standard error.
How do you calculate standard error?
Find the mean, find the sample standard deviation, take the square root of n, then divide the SD by that root. The calculator runs all four steps on a pasted list. With only s and n, use the second tab and divide directly.
How is standard error different from standard deviation?
One looks at the data, the other at the average. The SD shows how widely the values scatter within your sample, while the SE shows how precisely that sample pins down the population mean. Bigger samples leave the SD roughly where it was but shrink the SE.
Can the standard error be larger than the standard deviation?
Not for two or more values. √n is above 1 once n passes 1, so s ÷ √n is always below s. With a single value there is no standard deviation to divide, so the two are not defined.
What does a small standard error mean?
A small standard error means sample means from repeated samples would land close together, so your own sample mean is likely close to the population mean. A large one signals a rougher estimate, usually from a small sample or widely spread data.
Why does standard error matter?
It tells you how much to trust an average. Two groups with the same mean can differ in reliability: the one with the smaller standard error gives the more dependable estimate, and the standard error is the building block for confidence intervals and tests.
What is the difference between raw data and summary data?
Raw data is the list of individual values, so the calculator can work out the mean and sample SD itself. Summary data is just the standard deviation and sample size, taken from a paper or report, and is enough to get the standard error.
Why is n − 1 used for raw data?
A sample tends to understate the spread of the full population, so the sample SD divides the sum of squared deviations by n − 1 (the degrees of freedom) instead of n. This adjusted s then goes into s ÷ √n.
Does standard error have units?
Yes, it matches the units of your data. For test scores in points, the standard error is also in points. For heights in inches, the standard error is in inches.
What is the symbol for standard error?
Most sources write SE, or SEM for the standard error of the mean. Some textbooks use σ with a bar over x (σ_x̄) when the population SD is known, and s with a bar over x (s_x̄) when it is estimated from a sample.
Is standard error the same as margin of error?
No. The margin of error is the standard error multiplied by a critical value, so it is always wider. The standard error is the building block; the margin of error is what you add and subtract to form a confidence interval.
How do I reduce the standard error?
Collect more data. Because n sits under a square root, you need four times as many values to halve the standard error. More consistent measurements, which lower s, also help.
Easy Stat Calc · Results checked against Python, R and Excel · Last updated November 15, 2026 · Methodology