
Paste numbers or words to find the mode, every mode if there is a tie, with how often each value appears. A second tab finds the modal class and estimated mode of grouped data.
Loading calculator…
This free mode calculator is a mode finder for lists of numbers, words and categories. It tells you whether your data has one mode, two modes, several modes or none, and shows a frequency table and chart so you can see why. To see the mean and median too, use the mean median mode calculator.
How to use this mode calculator
- Enter your data. Type numbers or words separated by commas, or one per line. A column copied out of Excel works too.
- Press Calculate. The mode appears first, with a label such as unimodal, bimodal or no mode, plus its count.
- Read the table and chart. Every value is counted, with its share of the data, and the mode bars are marked.
- Have class intervals instead? Open the Grouped data tab and enter each class with its frequency.
Upper and lower case count as the same word unless you switch that off. An empty entry is ignored.
What is the mode?
The mode is whichever value shows up the most times in a data set. Finding the mode of a data set depends only on how often values repeat, never on how large they are, which is why it is the one measure of central tendency that also fits words, colors and other categories. In math, the word mode means the most common value, so “what does mode mean in math” has a one-line answer: the value with the highest count. A data set can have one mode, several modes or no mode at all.
How to find the mode: worked example
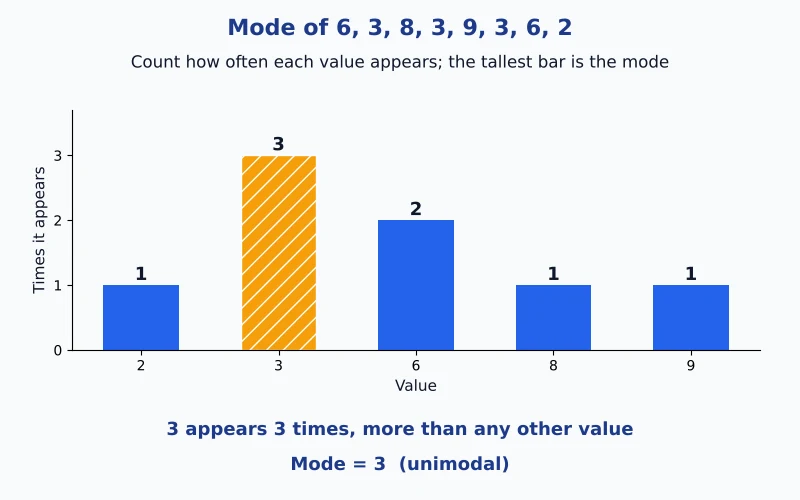
Learning how to calculate mode by hand starts with a tally: count how many times each value appears and pick the highest count. Take 6, 3, 8, 3, 9, 3, 6 and 2.
- Sort the numbers so repeated values sit together: 2, 3, 3, 3, 6, 6, 8, 9.
- List each different value once: 2, 3, 6, 8, 9.
- Count each one: 2 appears once, 3 appears three times, 6 appears twice, 8 once and 9 once.
- Find the highest count: three, which belongs to 3.
- State the mode: 3.
| Value | Count | Share of 8 values |
|---|---|---|
| 3 (mode) | 3 | 37.5% |
| 6 | 2 | 25% |
| 2 | 1 | 12.5% |
| 8 | 1 | 12.5% |
| 9 | 1 | 12.5% |
The counts add up to 8, the number of values, which is a quick check that nothing was missed.
Unimodal, bimodal, multimodal or no mode
The number of modes names the shape of the data. The calculator labels your result with one of these.
| Type | What happens | Example | Mode(s) |
|---|---|---|---|
| Unimodal | One value has the highest count | 6, 3, 8, 3, 9, 3, 6, 2 | 3 |
| Bimodal | Two values tie for the highest count | 2, 4, 4, 5, 7, 7, 9 | 4 and 7 |
| Multimodal | Three or more values tie | 1, 1, 2, 2, 3, 3, 4 | 1, 2 and 3 |
| No mode | No value repeats | 11, 14, 18, 23, 27, 31 | none |
A tie is not a mistake. Both values are modes, and a tool that reports only one of them has hidden half the answer.
Mode of words and categories
Counting works the same way for text. In red, blue, red, green, blue, red, red appears three times, blue twice and green once, so the mode is red. This is how you find the most common shirt size, survey answer or product color. Upper and lower case count as one word by default, so Red and red are not counted separately.
Mode calculator for grouped data
When data come as class intervals, you cannot see single values, so you find the modal class first: the class with the highest frequency. Then the mode is estimated with this formula:
Mode = L + (fm − f1) ÷ (2fm − f1 − f2) × h
Here L is the lower boundary of the modal class, fm its frequency, f1 the frequency of the class before it, f2 the frequency of the class after it, and h the class width. The formula assumes equal class widths.

| Class | Frequency |
|---|---|
| 0-10 | 5 |
| 10-20 | 12 |
| 20-30 (modal class) | 20 |
| 30-40 | 9 |
| 40-50 | 4 |
The modal class is 20-30, so L = 20, fm = 20, f1 = 12, f2 = 9 and h = 10. That gives 20 + (20 − 12) ÷ (2 × 20 − 12 − 9) × 10 = 20 + 80 ÷ 19 = 24.2105. If the modal class is the first or last class, the missing neighbor frequency is taken as 0.
Where the mode is used in real life
The mode answers questions about what is most common, which makes it useful whenever the data are categories or counts. A store looks at the most frequently sold size to decide what to stock. A survey reports the most common answer. A factory finds the most common type of defect, and a website finds the busiest hour of the day. In each case the average of the numbers would be meaningless, but the most frequent value tells you what to act on.
Finding the mode with software
| Tool | What it returns | Note |
|---|---|---|
| =MODE.SNGL(A2:A9) | The first mode only | Same as the older =MODE |
| =MODE.MULT(A2:A9) | Every mode, as an array | Enter as an array formula in older Excel |
| =INDEX(A2:A9,MODE(MATCH(A2:A9,A2:A9,0))) | The first mode of text | MODE ignores text, so use this for words |
| TI-83 / TI-84 | No mode key | Sort the list with SortA( and count the repeats |
All the spreadsheet formulas return #N/A when no value repeats. The tool also fills in these formulas for your pasted data. In 2, 4, 4, 5, 7, 7, 9, =MODE.SNGL gives 4 only, while =MODE.MULT gives 4 and 7.
Where the mode fits among the averages
The mode gives the most common value. To compare it with the typical value in the middle and the arithmetic average, see all three side by side with mean, median and mode, or start with the mean calculator. For the spread of your data, see the standard deviation calculator, and for more tools open the descriptive statistics hub.
Mode calculator FAQs
What is the mode in statistics?
In statistics, the mode is the entry with the highest count. In 6, 3, 8, 3, 9, 3, 6 and 2, the value 3 appears three times and every other value appears fewer times, so the mode is 3. It is the only one of the common averages that also works for words and categories.
What does mode mean in math?
In math, mode means the most frequent value in a data set. The mode of a data set is found by counting, not by adding or sorting by size. A set can have one mode, several modes or none.
How do you find the mode?
Count how many times each value appears, then pick the value with the highest count. Sorting the list first makes repeats easy to see, and a tally table keeps the counts tidy. If two or more values share the highest count, all of them are modes.
Can a data set have more than one mode?
Yes. Two modes make the data bimodal, as in 2, 4, 4, 5, 7, 7, 9 (modes 4 and 7). Three or more make it multimodal. The calculator lists every mode, never just the first.
Can there be no mode?
Yes. When no value repeats, as in 11, 14, 18, 23, 27 and 31, none is more common than another, so the data has no mode. Some books also say there is no mode when every value appears equally often more than once; the calculator labels that case clearly.
What is the mode of words or categories?
Count each word and choose the most frequent one. In red, blue, red, green, blue, red the mode is red, which appears three times. Because it needs only counting, the mode is the only average that works for colors, brands, or survey answers.
How do you find the mode of grouped data?
First find the modal class, the class with the highest frequency. Then estimate the mode with L + (fm − f1) ÷ (2fm − f1 − f2) × h, where L is the lower boundary of the modal class, fm its frequency, f1 and f2 the frequencies before and after it, and h the class width.
What is the difference between MODE, MODE.SNGL and MODE.MULT in Excel?
MODE and MODE.SNGL return only the first mode they find. MODE.MULT returns every mode as an array. All of them return #N/A when no value repeats, and they ignore text, so words need an INDEX and MATCH formula.
Easy Stat Calc · Results checked against Python, R and Excel · Last updated November 13, 2026 · Methodology