Paste your numbers, a frequency table or values with probabilities to get the sample and population variance at once, with the working shown step by step.
Loading calculator…
Variance tells you how widely a set of numbers is scattered around its mean. This free online variance calculator works as a sample variance calculator and a population variance calculator at once, giving the sample variance (s²) and the population variance (σ²) together, along with the mean, count, sum and sum of squares. It is also a mean and variance calculator: every result starts from the mean, so you see both in one place.
A table shows each value’s deviation from the mean, its square and the share of the total it adds, and a chart makes the biggest contributors easy to spot. Need the variance of a random variable? Switch to the tab for values and probabilities.
How to use this variance calculator
- Choose the input type. The first tab takes a plain list of numbers, the second takes values that repeat together with counts, and the third takes a random variable with probabilities.
- Enter your data. Type or paste the numbers with commas, spaces or line breaks between them; copy and paste from a spreadsheet column or a document works. In the other two tabs write one pair on each line, such as 4, 5.
- Set Sample or Population. Keep Sample for data drawn from a bigger group, and switch to Population only when you have measured everyone. Both variances always appear; the switch decides which is shown large.
- Press Calculate. You get the variance, the mean, n, the sum and the sum of squares, a step table and a chart of the squared deviations.
Sample variance needs two or more values. The tool tells you when something in the input was skipped or does not add up, for example probabilities that do not total 1.
What is variance?
Variance is a measure of dispersion, also called variability: how widely a set of numbers is spread. Take each value’s distance from the mean, square it, and average the results: that number is the variance. Squaring does two things. It makes every difference positive, so values above and below the mean cannot cancel each other out, and it gives far-away values extra weight.
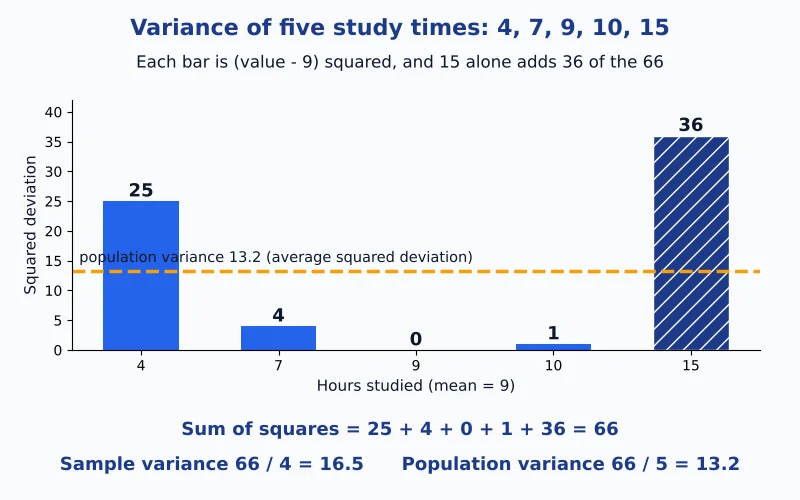
That is why one extreme value can raise the variance a lot. In the example further down, the single value 15 supplies more than half of the whole sum of squares. Variance is the foundation of many other statistics, including the standard deviation, confidence intervals, regression and analysis of variance.
Variance formula: sample and population
The variance formula has the same shape for a population and a sample. Only the divisor changes. The symbol for variance is σ² (sigma squared) for a population and s² for a sample.
Population variance formula
σ² = Σ(x − μ)² ÷ N, where μ is the population mean, N counts every value in the whole population and Σ means add up every term.
Sample variance formula
s² = Σ(x − x̄)² ÷ (n − 1), where x̄ is the sample mean and n counts the values in the sample.
The top part, Σ(x − mean)², goes by the name sum of squares (SS). So variance is simply SS ÷ N for a population and SS ÷ (n − 1) for a sample. The table collects the symbols and equations side by side.
| Quantity | Population | Sample |
|---|---|---|
| Mean | μ = Σx ÷ N | x̄ = Σx ÷ n |
| Sum of squares | SS = Σ(x − μ)² | SS = Σ(x − x̄)² |
| Variance | σ² = SS ÷ N | s² = SS ÷ (n − 1) |
| Standard deviation | σ = √σ² | s = √s² |
| Divisor | N | n − 1 |
A quick method for working by hand is the computational formula: SS = Σx² − (Σx)² ÷ n. It gives the same sum of squares without subtracting the mean from every value first, and the solved example below uses it as a cross-check.
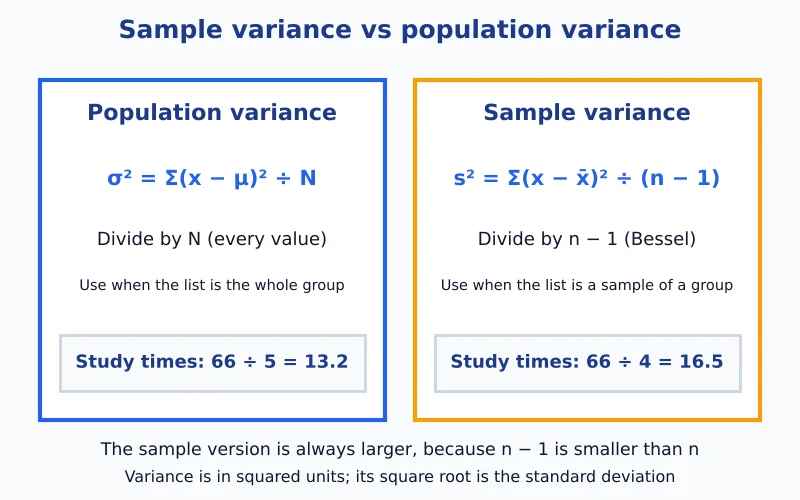
Use the population version only when your list really is everything. In most coursework, surveys and experiments the numbers come from a sample, so the sample variance with n − 1 is the right choice. This is the variance of a sample, and it is the default in the calculator. Class intervals in grouped data are not handled by this tool; for repeated single values, use the frequency table tab.
How to find variance: solved example 1 (raw data)
A student logs the hours studied in five weeks: 4, 7, 9, 10 and 15. Here is how to calculate variance step by step, by hand.
- Find the mean. (4 + 7 + 9 + 10 + 15) ÷ 5 = 45 ÷ 5 = 9 hours.
- Take each value minus the mean. The deviations are −5, −2, 0, 1 and 6.
- Square each deviation. 25, 4, 0, 1 and 36.
- Add them to get the sum of squares. 25 + 4 + 0 + 1 + 36 = 66.
- Divide. Sample variance: 66 ÷ (5 − 1) = 66 ÷ 4 = 16.5. Population variance: 66 ÷ 5 = 13.2.
| Value | Deviation (x − 9) | Squared deviation | Share of the sum of squares |
|---|---|---|---|
| 4 | −5 | 25 | 37.9% |
| 7 | −2 | 4 | 6.1% |
| 9 | 0 | 0 | 0% |
| 10 | 1 | 1 | 1.5% |
| 15 | 6 | 36 | 54.5% |
| Total | 0 | 66 | 100% |
Cross-check with the quick method: Σx² = 16 + 49 + 81 + 100 + 225 = 471 and (Σx)² = 45² = 2,025, so SS = 471 − 2,025 ÷ 5 = 471 − 405 = 66, the same answer. Paste 4, 7, 9, 10, 15 into the calculator and the check line shows the same mean of 9 and sum of squares of 66. Notice that the deviations add up to 0, which is true for any data set and makes a handy check on your arithmetic. The last column shows that 15 alone adds 54.5% of the total.
Solved example 2: variance from a frequency table
When values repeat, a frequency table is quicker. A shop records the items per order: 2 items in 3 orders, 4 items in 5 orders and 7 items in 2 orders, which is 10 orders in all.
- Mean. (2 × 3 + 4 × 5 + 7 × 2) ÷ 10 = 40 ÷ 10 = 4 items.
- Weighted squared deviations. 3 × (2 − 4)² = 12, 5 × (4 − 4)² = 0 and 2 × (7 − 4)² = 18, so the sum of squares is 30.
- Divide. Sample variance 30 ÷ 9 = 3.3333 and population variance 30 ÷ 10 = 3.
Enter the pairs 2, 3 then 4, 5 then 7, 2 on separate lines in the frequency tab to check it. The tool uses the counts as weights, so it works even for a very large total without writing the list out.
Solved example 3: variance of a random variable
For a discrete random variable the values come with probabilities. Let X be 0, 1 or 2 with probabilities 0.2, 0.5 and 0.3. The mean (expected value) is μ = 0 × 0.2 + 1 × 0.5 + 2 × 0.3 = 1.1. The variance is Σ p × (x − μ)²:
| x | Probability p | (x − 1.1)² | p × (x − 1.1)² |
|---|---|---|---|
| 0 | 0.2 | 1.21 | 0.242 |
| 1 | 0.5 | 0.01 | 0.005 |
| 2 | 0.3 | 0.81 | 0.243 |
| Total | 1 | 0.49 |
The variance is 0.49 and the standard deviation is 0.7. There is no sample or population choice here, since the probabilities already cover the entire distribution. To build such a table from an experiment or to see the distribution itself, use the distribution table calculator.
Why divide by n − 1? Sample vs population variance
In a sample you measure deviations from the sample’s own mean, because the true mean of the whole group is unknown. Data always sit nearer to their own average than to any other number, so the squared gaps add up to slightly too little. Divide by n and you would understate the real spread; divide by n − 1 and the estimate is unbiased on average. Statisticians call this Bessel’s correction.
The two results are tied together: sample variance = population variance × n ÷ (n − 1). For the study times, 13.2 × 5 ÷ 4 = 16.5. With 5 values the difference is 25%, with 50 values about 2%, and with 1,000 values almost nothing. This also explains why a single value has no sample variance: n − 1 would be zero.
Variance and standard deviation
Take the variance’s square root and you have the standard deviation. For the study times the sample variance of 16.5 hours² becomes a standard deviation of 4.062 hours, and the population values are 13.2 and 3.6332. Hours, dollars or points are easier to picture than hours squared, so reports tend to quote the standard deviation.
The variance is still the better quantity to calculate with, because variances of independent things add and the squares make the algebra clean. The standard deviation tool is the place for that figure and its own full working, and the standard deviation graph to see the spread on a histogram. To express the spread as a percentage of the mean, the coefficient of variation tool does the division for you; that percentage is also known as the relative standard deviation.
How to interpret variance
Variance has no universal good or bad value. A variance of 16.5 could be small for house prices and huge for exam marks. What matters is the comparison, and three habits keep it honest:
- Compare like with like. Only set variances side by side when both measure the same quantity on a similar scale.
- Remember the squares. Multiplying all the data by 10 multiplies the variance by 100, while adding a constant to every value leaves it unchanged.
- Look at the contributors. The step table and the chart show which values add the most. One distant value can dominate, as 15 does above.
A variance of exactly 0 means the values never differ. A low variance means the values sit close to the mean, and a high variance means they vary widely. The bigger the number, the wider the spread. If you need a measure that is less affected by extreme values, the median absolute deviation calculator is a good companion.
Calculate variance in Excel and on a TI-83 or TI-84
In a spreadsheet, put the numbers in one column, say A2:A8, and apply a single function. Under the results the tool writes the formula using your own cell range. The same column also gives the spread, and our guide to STDEV.S and STDEV.P in Excel and Google Sheets covers that step.
| Result | Excel or Sheets | TI-83 / TI-84 |
|---|---|---|
| Sample variance | =VAR.S(A2:A8) | Enter data in L1, run 1-Var Stats from the CALC menu, then square the Sx value. |
| Population variance | =VAR.P(A2:A8) | Use the same 1-Var Stats screen and square the σx value. |
Older versions of Excel use VAR and VARP instead of VAR.S and VAR.P. On a TI-83 or TI-84 the 1-Var Stats screen lists x̄, Sx, σx and n. The calculator does not show the variance directly, so square the standard deviation, or press VARS, choose 5:Statistics, pick Sx or σx and then press the x² key.
More calculators for averages and spread
Browse the descriptive statistics hub to see all the tools for averages and spread. Variance is measured around the average, which the mean tool finds, while the mean, median and mode calculator handles the other kinds of average, and the weighted mean calculator averages values that carry different weights. When two variables move together, the covariance tool uses the same idea, since the covariance of a variable with itself is its variance.
Variance calculator FAQs
What is variance in statistics?
Variance measures how spread out a set of numbers is around its mean. It averages the squared distances from the mean, so a variance of 0 means the data never change and a larger variance means the values are more scattered. For the study times 4, 7, 9, 10 and 15 the sample variance is 16.5.
What is the formula for variance?
Population variance is σ² = Σ(x − μ)² ÷ N and sample variance is s² = Σ(x − x̄)² ÷ (n − 1). In both, you subtract the mean from each value, square the result, add the squares to get the sum of squares, and divide. For 4, 7, 9, 10 and 15 the sum of squares is 66, so the sample variance is 66 ÷ 4 = 16.5 and the population variance is 66 ÷ 5 = 13.2.
What is the difference between sample variance and population variance?
Population variance divides the sum of squares by N and suits a list that covers the entire group. Sample variance divides by n − 1 and suits a list that stands in for a larger group. The sample value is always a little larger, by the factor n ÷ (n − 1).
Why do we divide by n − 1 for sample variance?
Deviations from the sample’s own mean are a bit too small, so dividing by n understates the spread. Using n − 1 (Bessel’s correction) removes that bias. The effect is large for small samples and tiny for big ones.
How do I calculate variance by hand?
Work out the mean, take it away from each value, square every gap, total the squares, then use n − 1 as the divisor for a sample and N for a population. The worked example above does this with five numbers, and the calculator’s step table shows the same columns for your own data.
How do I find variance on a TI-83 or TI-84?
Press STAT, choose 1:Edit and key the numbers into list L1. Then press STAT, move to CALC, choose 1:1-Var Stats and enter L1. The screen shows x̄, Sx and σx. Square Sx for the sample variance or σx for the population variance, or press VARS, choose 5:Statistics and then Sx or σx before squaring it.
How do I calculate variance in Excel?
Use =VAR.S(A2:A8) for the sample variance and =VAR.P(A2:A8) for the population variance, with your own range. Older versions of Excel use VAR and VARP. Google Sheets uses the same VAR.S and VAR.P names.
How do I find the standard deviation from the variance?
Take the square root. A sample variance of 16.5 gives a standard deviation of √16.5 = 4.062. To go the other way, square the standard deviation. The standard deviation is easier to read because it uses the data’s own units.
Can variance be negative?
No. Every term in the sum is a square, so it cannot be below zero, and variance is zero only when all the values are identical. A negative answer points to a slip in the arithmetic or the formula.
What are the units of variance?
Squared units: data in hours give a variance in hours squared, which is a reason many reports quote the standard deviation instead. Variance is still the quantity that adds up cleanly, which is why it is used in many formulas.
What do a high or a low variance tell me?
A low variance means the values sit close to the mean, and a high variance means they are widely spread. Whether a given number is large depends on the scale of the data, so compare variances only for data in the same units.
How do I calculate the variance of 1, 2, 3, 4, 5, or of two numbers?
For 1, 2, 3, 4 and 5 the mean is 3, the deviations are −2, −1, 0, 1 and 2, and the squares add up to 10. The sample variance is 10 ÷ 4 = 2.5 and the population variance is 10 ÷ 5 = 2. For two numbers such as 2 and 4 the mean is 3 and the sum of squares is 2, so the sample variance is 2 and the population variance is 1.
What does a 20% variance mean?
In budgeting and business reports, a 20% variance usually means a figure is 20% above or below a plan or forecast. That is a percent difference, not the statistical variance this calculator finds, which measures how spread out data are around their mean.
Can I calculate variance for grouped data?
This calculator takes single values, optionally with frequencies. If your data are in class intervals, one rough approach is to enter every class’s middle point with the class count as its frequency; treat the answer as an estimate, not the exact variance.
How do I find the variance from a frequency table or from probabilities?
For a frequency table, multiply each squared deviation by its frequency, add them, and divide by the total count minus 1 (sample) or by the total count (population). For a random variable with probabilities, use variance = Σ p × (x − μ)², where μ is the sum of p × x. The calculator has a tab for each.
Easy Stat Calc · Results checked against Python, R and Excel · Last updated November 10, 2026 · Methodology