Enter a set of numbers, or just a mean and standard deviation, to get the coefficient of variation as a percentage. Add a second data set to see which one is more consistent.
Loading calculator…
The coefficient of variation is the standard deviation written as a share of the mean, so it shows how spread out your numbers are relative to their size. This free online coefficient of variation calculator (also called a CV calculator) gives you both the sample and the population value every time, as a percentage and as a plain ratio, with a step-by-step solution, and the switch decides which of the two becomes the big headline.
It also reports the mean and the standard deviation behind the result, along with a brief working, which shows how to calculate coefficient of variation by hand. If you only know the mean and standard deviation, use the second tab. It works from raw data or from summary data. To compare two groups, open the second data set and the tool tells you which has the smaller CV.
How to use this coefficient of variation calculator
- Pick a tab. Use Data list for raw data. Use I know the mean and SD for summary data, when you already have those two values.
- Enter your numbers in Data set A, one per line or as comma-separated values; you can also paste a column from a spreadsheet. In the second tab, type the mean and the standard deviation, plus the sample size if you want the small-sample note.
- Pick the dataset type, Sample or Population. Leave it on Sample unless your list holds every member of the group.
- Press Calculate. The results show the CV as a percent and as a ratio, next to the mean, the SD and the working.
- To compare, add a second data set. A table and a bar graphic show each CV side by side, with one sentence saying which set varies less relative to its mean.
The tool needs at least two values in a list. If the mean is zero it says the coefficient of variation is not defined, instead of showing a meaningless number.
What is the coefficient of variation?
The coefficient of variation measures relative variability, also called relative dispersion: how big the standard deviation is compared with the mean. A standard deviation of 5 means one thing when the mean is 20 and something quite different when the mean is 2,000. Dividing by the mean puts both on the same footing. The result has no units, so it works for measurements in dollars, minutes, millimeters or test points alike, and it lets you compare the dispersion of datasets in different units.
People use it to answer questions such as which machine is more consistent, which investment of equal average return varies more, or which of two measurement methods is more precise. It is also called the relative standard deviation when it is written as a percentage.
Coefficient of variation formula
The coefficient of variation formula divides the standard deviation by the mean. That is the ratio form; multiplying by 100 gives the percentage form, also called the percent form:
- Sample: CV = s ÷ x̄, or (s ÷ x̄) × 100%.
- Population: CV = σ ÷ μ, or (σ ÷ μ) × 100%.
Here s and σ are the sample and population standard deviations and x̄ and μ are the sample and population means. The only difference between the two versions is the n − 1 or n inside the standard deviation, which our standard deviation tool explains in full.
How to calculate the coefficient of variation: solved example 1 (raw data)
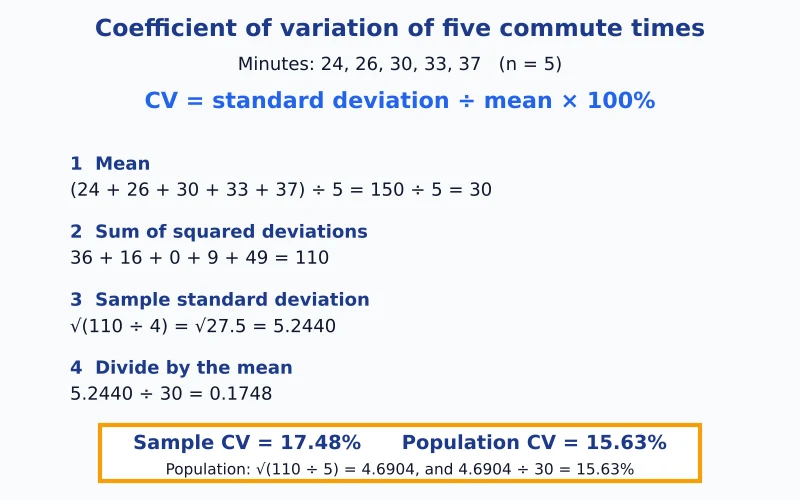
Five daily commute times, in minutes, are 24, 26, 30, 33 and 37. Here is how to find the coefficient of variation step by step.
- Find the mean. (24 + 26 + 30 + 33 + 37) ÷ 5 = 150 ÷ 5 = 30 minutes.
- Find the sum of squares of the deviations. 36 + 16 + 0 + 9 + 49 = 110.
- Find the sample standard deviation. √(110 ÷ 4) = √27.5 = 5.2440 minutes. For a population divide by 5 instead, which gives 4.6904.
- Divide the standard deviation by the mean. 5.2440 ÷ 30 = 0.1748.
- Write it as a percent. 0.1748 × 100 = 17.48% for the sample. The population value is 4.6904 ÷ 30 = 15.63%.
Enter these five values in the tool and its check line reads mean 30 and standard deviation 5.2440, with 17.48% as the headline. If you want every squared deviation laid out in a table, the standard deviation calculator shows it.
Solved example 2: coefficient of variation from summary data
Sometimes a report gives only the mean and the standard deviation. A set of 12 lab measurements has a mean of 52 and a sample standard deviation of 6.5. Divide: 6.5 ÷ 52 = 0.125, so the CV is 12.5%. Use the I know the mean and SD tab for this. The result uses the standard deviation exactly as you typed it, so it is a sample CV if that value came from n − 1 and a population CV if it came from n.
Notice that you cannot get a sample and a population value from a mean and SD alone, because the divisor is already built into the standard deviation. With raw data the tool shows both.
Unbiased coefficient of variation (small-sample correction)
The sample CV tends to come out slightly too low when the sample is small. A common small-sample correction multiplies it by (1 + 1 ÷ 4n), where n is the sample size. The unbiased coefficient of variation therefore equals CV × (1 + 1 ÷ 4n). For the 12 lab measurements above, 12.5% × (1 + 1 ÷ 48) = 12.76%. For the five commute times it is 17.48% × 1.05 = 18.35%. As n grows, the factor approaches 1 and the correction disappears, which is why it matters only for small samples. The calculator shows this value whenever the sample size is known.
How to interpret the coefficient of variation
A small CV signals consistent values near the mean, which makes them more predictable. A large CV means they are widely scattered around it. A CV of 100% means the standard deviation equals the mean. Rules of thumb are often quoted, but they are only a starting point:
| CV | Usual reading | Meaning for the data |
|---|---|---|
| Under about 10% | Low variation | Values cluster tightly around the mean |
| About 10% to 30% | Moderate variation | A fair amount of scatter |
| Over about 30% | High variation | Values are widely spread relative to the mean |
What counts as acceptable depends on the field and on what you are measuring, so compare your CV with similar data rather than with a fixed cutoff. Our five commute times, at 17.48%, fall in the middle band: the typical commute is 30 minutes and a typical day differs from that by about 5.
Coefficient of variation vs standard deviation
The standard deviation measures spread in the units of the data, while the coefficient of variation measures spread relative to the mean. That is why the standard deviation can mislead when you compare data sets with very different sizes. Suppose shop A sells about $448 a day and shop B about $2,033 a day. The daily sales standard deviation is 42.03 for shop A and 226.77 for shop B, so shop B looks 5.4 times as spread out. Divide by each mean and the picture changes: the CVs are 9.38% and 11.15%, so shop B is only about 1.19 times as variable.

Use the standard deviation for one data set or for data in the same units, and use the CV to compare. The mean tool finds the average, and the mean absolute deviation calculator is another measure of spread in the units of the data. The variance tool gives the squared version of the spread, with its sum of squares.
Uses and applications of the coefficient of variation
- Comparing datasets with different means. This is the main use: it tells you which group has more variability once the size of the numbers is removed.
- Quality control and quality assurance. A filling machine set to 500 g with a standard deviation of 4 g has a CV of 0.8%. A lower CV means a more consistent process.
- Laboratory work. In analytical chemistry, the relative standard deviation of repeated assay results is a standard way to report the precision of a method.
- Finance. The CV is read as risk per unit of average return, a way to compare the volatility of investments such as stocks or bonds with different returns. This describes the numbers only and is not investment advice.
- Risk assessment in other fields such as sales, weather or manufacturing, wherever you want to compare how steady two series are.
When not to use the coefficient of variation
- The mean is zero or very close to zero. Dividing by a number near zero makes the CV unstable and very large, and at exactly zero it is undefined. The values 5 and −5 have a mean of 0.
- The data mix positive and negative values (use positive values only, or negative values only). The mean can be small even when the spread is large, which makes the CV look huge without meaning much.
- The scale has no true zero. Temperature is the classic case. The values 10 °C and 20 °C give a CV of 47.14%, but the same two temperatures in Fahrenheit, 50 °F and 68 °F, give 21.57%. A measure that changes with the units is not describing the spread fairly.
- The data contain extreme outliers. Both the mean and the standard deviation react strongly to them, and so does the CV.
If the mean is negative, the CV comes out negative too. Report the relative standard deviation, which is the absolute value of the CV, so it is always positive.
Relative standard deviation
Relative standard deviation (RSD, or percent RSD) is the coefficient of variation expressed as a percentage and taken as an absolute value. The calculation is identical: divide the standard deviation by the mean and multiply by 100. Laboratories, chemistry and quality control tend to say RSD, while statistics courses say coefficient of variation. A result written as “mean ± SD” can be turned into an RSD by dividing the SD by the mean. The sign of the mean sets the sign of the CV: a positive mean gives a positive CV and a negative mean gives a negative one, while the RSD drops the sign.
Calculate the coefficient of variation in Excel or on a TI-83/84
No spreadsheet has a built-in coefficient of variation function, so divide the standard deviation by the average. Say your numbers are in A2:A6, and you want to calculate CV in Excel or Google Sheets. The tool writes these formulas with your actual cell range in its own “check it yourself” lines.
| Task | Spreadsheet formula | Graphing calculator steps |
|---|---|---|
| Sample CV | =STDEV.S(A2:A6)/AVERAGE(A2:A6), formatted as a percentage | STAT, 1:Edit, type the data into L1. Then STAT, CALC, 1-Var Stats, L1. Divide Sx by x̄. |
| Population CV | =STDEV.P(A2:A6)/AVERAGE(A2:A6), formatted as a percentage | From the same screen, divide σx by x̄. |
Older versions of Excel use STDEV and STDEVP in place of the two functions above. The 1-Var Stats screen of the TI-83 and TI-84 lists x̄, Sx, σx and n, so there is nothing else to enter.
More calculators for spread and averages
Start from the descriptive statistics hub for every measure of center and spread. The mean, median and mode calculator covers the averages, and the standard deviation graph draws the spread of one list as a histogram. If you are comparing how two variables move together instead, use the covariance tool.
Coefficient of variation calculator FAQs
What is the coefficient of variation?
The coefficient of variation (CV) is the standard deviation divided by the mean. It tells you how large the spread is compared with the typical value, so it has no units and lets you set side by side data recorded on different scales.
What is the formula for the coefficient of variation?
CV = standard deviation ÷ mean, usually multiplied by 100 to give a percent. For a sample use s ÷ x̄, and for a whole population use σ ÷ μ. For the five commute times, 5.2440 ÷ 30 = 0.1748, which is 17.48%.
Is the coefficient of variation a percentage?
It can be written either way: 0.25 as a ratio is the same as 25%. For the commute times the plain ratio is 0.1748 and the percentage is 17.48%. Most textbooks, spreadsheets and labs report it as a percentage, which is why this calculator shows the percent as the headline and the ratio under it.
What is a good coefficient of variation?
There is no single good value, because it depends on the field. A lower CV means the data sit closer to the mean. Many people call a CV under about 10% low and over about 30% high, but those are rules of thumb only. A method used to measure the same sample twice usually needs a much lower CV than a survey of household spending.
Can the coefficient of variation be greater than 1 (or 100%)?
Yes. If the standard deviation exceeds the mean, the ratio is above 1, which is a CV above 100%. The values 1, 1, 1 and 20 have a mean of 5.75 and a sample standard deviation of 9.50, so the CV is about 165%. A value that high usually signals a skewed data set or an outlier.
Can the coefficient of variation be negative?
Only when the mean is negative, because a standard deviation is never below zero. In that case the relative standard deviation, which is the absolute value of the CV, is the number that is usually reported. A mean of exactly 0 gives no coefficient of variation at all.
What does a high or low CV mean?
A low CV signals consistent, predictable values near the mean. A high CV means they vary a lot relative to the mean. Neither is better in itself: whether a low or high CV is better depends on the goal, such as a tight process in manufacturing versus a wide range in a diverse group.
What is the coefficient of variation used for?
It is used to compare variability between data sets with different means or units, to judge the consistency of a process in quality control, to report the precision of a laboratory method, and to compare risk against average return in finance.
Which do I need: the sample or the population CV?
Choose the sample version when the numbers were drawn from a larger group, as in most coursework and real studies, and the population version only when the list covers every member. The tool prints both, so take whichever your question names.
How does the coefficient of variation differ from the standard deviation?
A standard deviation is stated in the data’s own units and grows whenever the numbers grow. The CV divides it by the mean, so it measures the spread relative to the size of the numbers. Stick with the standard deviation inside one data set, and switch to the CV when the means differ.
How do I calculate the coefficient of variation in Excel?
Excel has no CV function, so divide two functions: =STDEV.S(A2:A6)/AVERAGE(A2:A6) for a sample, or =STDEV.P(A2:A6)/AVERAGE(A2:A6) for a population. Format the cell as a percentage to see 17.48%.
Are the coefficient of variation and RSD the same thing?
They are the same calculation. Relative standard deviation (RSD, or percent RSD) is the CV written as a percentage, and it is taken as the absolute value so it is never negative. Laboratories tend to say RSD, and statistics courses tend to say coefficient of variation.
When should I not use the coefficient of variation?
Avoid it when the mean is zero or close to zero, when the data include both positive and negative values, and when the scale has no true zero, such as temperature in degrees Celsius or Fahrenheit. In those cases a small change in the mean produces a large change in the CV, and it stops describing the spread fairly.
Does the coefficient of variation change if I change the units?
No. Converting minutes to seconds multiplies the mean and the standard deviation by the same amount, so the ratio stays 17.48%. That is the reason the CV is used to compare data measured in different units.
Easy Stat Calc · Results checked against Python, R and Excel · Last updated November 10, 2026 · Methodology