
Enter two paired lists to get the sample and population covariance with the full working, plus a scatter plot that shows why the sign is positive or negative.
Loading calculator…
This covariance calculator takes a list of X values and a list of Y values and finds how the two move together. It is a sample covariance calculator and a population covariance calculator at once: both results appear every time, and the switch only picks which one is shown large. It also gives the means, the sum of products, the correlation coefficient and a small 2 × 2 covariance matrix.
Every step appears in a working table, so you can follow how to calculate covariance by hand. The scatter plot splits the points at the two means and marks each point as a positive or a negative product, so the sign of the answer is easy to see. If you only know the correlation and the two standard deviations, a second mode finds the covariance without the raw data.
How to use this covariance calculator
- Type or paste your X values in the first box and your Y values in the second. Separate numbers with commas, spaces or new lines. You can also paste two columns copied from a spreadsheet.
- Choose sample or population. Sample (n − 1) is the default and is what most courses want.
- Press Calculate. You get the covariance, both means, the number of pairs and the sum of products, followed by the working table, the steps and the scatter plot.
- Read the plot. Dashed lines mark the means. Blue circles are pairs with a positive product, navy diamonds have a negative product.
- Try an example button to see a positive, a negative and a near-zero relationship.
X and Y must have the same number of values, one Y for each X. If they differ, the tool tells you how many each list has.
What is covariance?
Covariance is a number that describes how two variables change together; the covariance definition in one line is the average product of paired deviations from the two means. If values of X above its mean usually come with values of Y above its mean, the covariance is positive. If X above its mean usually comes with Y below its mean, it is negative. If there is no straight-line pattern, it is near zero. For example, hours studied and quiz score tend to rise together, while a car’s age and its value tend to move in opposite directions.
| Covariance | What it says | Example |
|---|---|---|
| Positive | X and Y tend to be above or below their means together | Hours studied and quiz score |
| Negative | When one is above its mean, the other tends to be below | Car age and car value |
| Near zero | No straight-line pattern between X and Y | Shoe size and quiz score |
The sign shows direction only. It does not say that one variable causes the other, and its size depends on the units, which is why correlation is used to compare different data sets.
Covariance formula: sample and population
The covariance formula multiplies each pair of deviations from the means and averages the products. The two versions differ only in the divisor:
- Sample covariance: cov(X, Y) = Σ (xᵢ − x̄)(yᵢ − ȳ) ÷ (n − 1).
- Population covariance: cov(X, Y) = Σ (xᵢ − μx)(yᵢ − μy) ÷ N.
In the formula for covariance, x̄ and ȳ are the means of the two lists and n is the number of pairs. The sample covariance equation divides by n − 1 for the same reason the sample standard deviation does; our standard deviation tool explains that correction. Because the sample version divides by n − 1, the sample covariance is always the population covariance times n ÷ (n − 1).
Symbol key. Σ means add up every term. xᵢ and yᵢ are the i-th pair of values. x̄ and ȳ are the two sample means (μx and μy when you have a whole population). Use n for the count of pairs in a sample and N for the count in a whole population.
An equivalent covariance equation, often used in probability, is cov(X, Y) = E[(X − E(X))(Y − E(Y))] = E(XY) − E(X) · E(Y): the expected product of the deviations, which equals the average of the products minus the product of the averages. Setting Y equal to X gives the variance, so cov(X, X) = Var(X).
How to calculate covariance: a worked example
Five students record hours studied (X) and quiz score (Y): X = 2, 3, 5, 6, 9 and Y = 60, 64, 70, 74, 87. Here is how to find covariance step by step.
- Find the means. x̄ = 25 ÷ 5 = 5 and ȳ = 355 ÷ 5 = 71.
- Subtract the means. The deviations of x are −3, −2, 0, 1, 4. The deviations of y are −11, −7, −1, 3, 16.
- Multiply each pair. The products are 33, 14, 0, 3 and 64.
- Add them. The sum of products is 114.
- Divide. Sample covariance = 114 ÷ 4 = 28.5. Population covariance = 114 ÷ 5 = 22.8.

Enter the same two lists and the working table shows exactly these products, with the total at the bottom. The covariance is positive, so hours studied and score tend to be above their means together.
Why the sign is positive or negative: the four quadrants
Draw a vertical line at the mean of X and a horizontal line at the mean of Y, and the plot splits into four quadrants. A point in the upper right (both above their means) or the lower left (both below) has a positive product. A point in the upper left or lower right (one above, one below) has a negative product. The covariance is the total of all those products, divided by n − 1 or n, so it is positive when most of the weight falls in the first two quadrants.
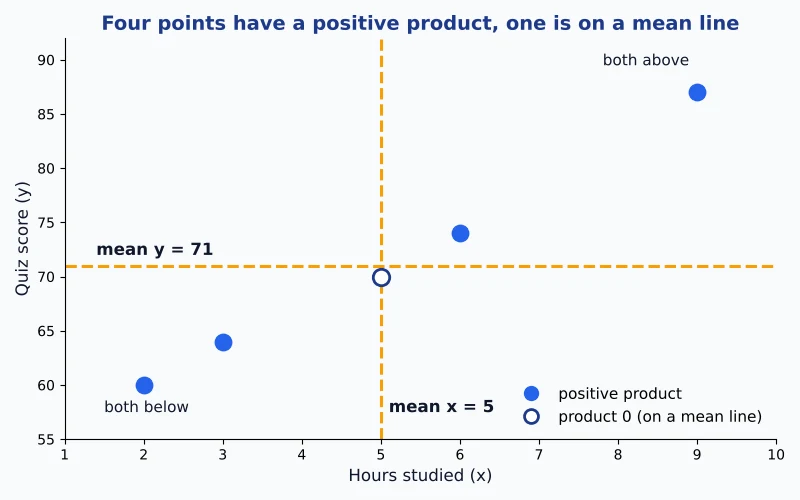
In this plot four of the five points sit in the both-above and both-below corners. The point at 5 hours lies exactly on the mean line, so its product is 0 and the tool draws it as a hollow circle. If you want a chart of one list only, the standard deviation graph draws that.
Covariance vs correlation
Covariance and correlation both measure how two variables move together, but covariance carries the units of the data and correlation does not. The correlation coefficient divides the covariance by both standard deviations: r = cov(X, Y) ÷ (sx · sy). For the five students, r = 28.5 ÷ (2.7386 × 10.4403) = 0.9968, and the calculator shows this value under the result as a quick covariance and correlation check.
| Covariance | Correlation (r) | |
|---|---|---|
| Range | No limit, any size | −1 to 1 |
| Units | Units of X times units of Y | None |
| Hours changed to minutes | 28.5 becomes 1,710 | Stays 0.9968 |
| Best use | Direction, and as a building block (variance, matrices) | Comparing the strength of relationships |
To go the other way, multiply: cov(X, Y) = r · sx · sy. With r = 0.9968, sx = 2.7386 and sy = 10.4403 the product is about 28.5, the same covariance up to rounding. The “I know r and the standard deviations” mode of the calculator does this when you do not have the raw data.
Excel and TI-84 steps for covariance
Here is how to calculate covariance in Excel or Google Sheets. Say the X values are in A2:A7 and the Y values in B2:B7. These formulas should match the tool, and the Excel line under the result is filled in with your real cell ranges.
| What to find | Excel or Google Sheets | TI-83 or TI-84 calculator |
|---|---|---|
| Sample covariance | =COVARIANCE.S(A2:A7,B2:B7) | Type X into L1 and Y into L2 (STAT, 1:Edit), run 2-Var Stats with L1, L2, then (Σxy − n · x̄ · ȳ) ÷ (n − 1) |
| Population covariance | =COVARIANCE.P(A2:A7,B2:B7) | The same top, divided by n |
Neither TI model has a covariance key, but the 2-Var Stats screen lists n, x̄, ȳ and Σxy, which is all the shortcut needs. In older Excel versions the population function is simply COVAR.
Covariance matrix for two variables
A covariance matrix lists the variances on the diagonal and the covariance in the other two cells. For two variables it is a 2 × 2 grid, and the calculator shows it under the result using the same sample or population choice. For the five students the sample matrix is 7.5 and 28.5 in the first row, and 28.5 and 109 in the second. A matrix for three or more variables needs a different tool.
Related calculators for one list or a table
If you have only one list, the mean tool and the standard deviation tool are the right place. The covariance calculator is for two lists that belong together, pair by pair. For a probability table instead of data, the distribution table calculator gives the expected value and variance of the table.
Covariance calculator FAQs
What is covariance?
Covariance measures whether two variables tend to move together. Each pair of values is compared with the two means: when x is above its mean while y is above its mean, or both are below, the pair adds a positive product. When one is above and the other below, it adds a negative product. The covariance is the average of those products.
How do you calculate covariance?
Find the mean of X and the mean of Y, subtract each mean from its values, multiply each pair of deviations, total the products, then divide the total by one less than the number of pairs (sample) or by the number of pairs (population). For the five students above the products are 33, 14, 0, 3 and 64, the sum is 114, and 114 ÷ 4 = 28.5.
What is the covariance formula?
The sample covariance formula is cov(X, Y) = Σ(xᵢ − x̄)(yᵢ − ȳ) ÷ (n − 1). The population covariance formula is Σ(xᵢ − μx)(yᵢ − μy) ÷ N. Both multiply each pair of deviations from the means, add the products, and divide by n − 1 for a sample or by N for a population. This calculator applies whichever you choose.
Is my data a sample or a population?
If your pairs are a selection taken from a bigger group, which is the usual case in a statistics course, you want the sample covariance. Only when the pairs are every member of the group you care about do you want the population covariance. Both appear in the result, so read the one your problem asks for.
Can covariance be negative?
Yes. A negative covariance means that when one variable is above its mean the other tends to be below its own. For car age in years (1, 2, 4, 5, 7) and value in thousands of dollars (24, 21, 17, 15, 10), the sample covariance is −12.9.
Can covariance be greater than 1?
Yes. Covariance has no upper or lower limit, because it carries the units of both variables. Only the correlation coefficient is limited to values from −1 to 1. A covariance of 28.5 is perfectly ordinary for exam scores measured in points and hours studied.
What does a covariance of zero mean?
A covariance of zero means the positive and negative products cancel out, so there is no straight-line pattern between the two variables. A curved pattern can still exist, so zero does not prove the variables are unrelated.
Why must X and Y have the same number of values?
Covariance is built from pairs: the first x goes with the first y, the second with the second, and so on. If one list is longer, some values have no partner. The calculator tells you how many values each list has so you can find the missing or extra one.
What are the units of covariance?
The units of X multiplied by the units of Y, such as hours times points. Changing hours to minutes multiplies the covariance by 60 (28.5 becomes 1,710) while the correlation stays 0.9968. That is why correlation is used to compare relationships.
What is the difference between covariance and correlation?
Correlation is covariance divided by the product of the two standard deviations, r = cov(X, Y) ÷ (sx · sy). That division removes the units and keeps r between −1 and 1. Covariance tells you the direction of the relationship, and correlation tells you the direction and how tight it is.
How do you find covariance from correlation?
Multiply the correlation by both standard deviations: cov(X, Y) = r · sx · sy. With r = 0.9968, sx = 2.7386 and sy = 10.4403 the result is about 28.5 (28.5003 from these rounded values). Use the “I know r and the standard deviations” mode of the calculator to do this without the raw data.
Is the covariance of X with itself the variance?
Yes. cov(X, X) is the variance of X, because (x − mean)(x − mean) is the squared deviation. For X = 2, 3, 5, 6, 9 both give 7.5 as a sample. This is why a covariance matrix has the variances on its diagonal.
What is a covariance matrix, and does this calculator make one?
A covariance matrix lists the covariance of every pair of variables, with each variable’s variance on the diagonal. With two variables it is a 2 × 2 grid, and the calculator shows that grid under the result. Matrices for three or more variables are not built here.
How do I calculate covariance in Excel or on a TI-84?
In Excel or Google Sheets use =COVARIANCE.S(A2:A7,B2:B7) for a sample or =COVARIANCE.P(A2:A7,B2:B7) for a population. On a TI-83 or TI-84, enter the lists in L1 and L2 and run 2-Var Stats, then use (Σxy − n · x̄ · ȳ) ÷ (n − 1).
Easy Stat Calc · Results checked against Python, R and Excel · Last updated November 7, 2026 · Methodology