Find the mean absolute deviation of your numbers, with the distance of every value from the center, a bar chart and the working shown.
Loading calculator…
This free MAD calculator with steps, also called a mean absolute deviation calculator or an absolute deviation calculator, tells you how far your values are from their center on average. Enter your list and the tool gives you the mean and MAD together, then lists the distance of each value so you can check every step. You can measure from the median instead of the mean, or compare two data sets side by side.
MAD answers a simple question in plain words: on average, how far is a typical value from the center? It uses your data’s own units, so a MAD of 1.68 on lunch prices means about $1.68, which makes it one of the easiest measures of spread to explain.
How to use this MAD calculator
- Type or paste your numbers into the box, with commas, spaces or new lines between them. A column copied from a spreadsheet works too.
- Choose the center. Leave it on Mean for the usual mean absolute deviation, or pick Median to measure the distances from the median.
- Press Calculate. The MAD appears first, with the mean and the count, then a table with the distance of every value and the four steps of the working.
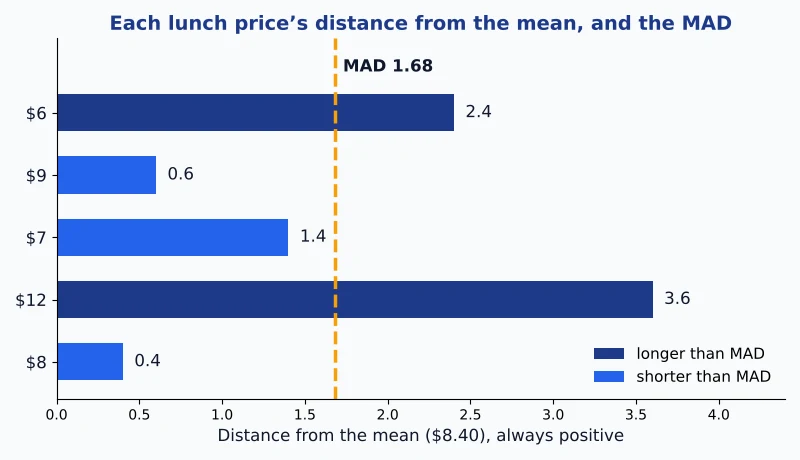
- Look at the bars. Each bar is one value’s distance from the center. Bars that reach past the dashed MAD line are the values that sit farther out than average.
To compare two lists, press “Compare two data sets” and fill in both boxes. The tool then gives each list its own MAD and says which one is more spread out. Anything that is not a number is skipped and listed, so nothing changes your answer unnoticed. Three example buttons load sample data, including the two-set comparison.
What is the MAD (mean absolute deviation)?
The mean absolute deviation, or MAD, summarizes how far a data set sits from its center. It averages the absolute distances between every value and the mean. “Absolute” means the minus sign is dropped, so a value 3 below the mean and a value 3 above it both count as 3 away. Unlike the variance, which is in squared units, it reports the spread in the same units as the data.
It is taught in US middle school math as a measure of variability (how much the data is dispersed), which is why many people search for “mad math” and “what is MAD in math”. Beyond the classroom it appears wherever a plain, explainable spread is needed:
- Practice and homework: comparing how consistent two sets of scores or measurements are.
- Quality checks: how far repeated measurements, such as part sizes or lab readings, stray from their average.
- Explaining results: people without a statistics background find an average distance easier to picture than a standard deviation.
A small MAD means the values are bunched close to the mean. A large MAD means they are spread out. A MAD of 0 means every value is the same.
MAD formula
MAD = Σ|xᵢ − x̄| ÷ n, where xᵢ is each value, x̄ (x-bar) is the mean, n is the count of values and Σ (sigma) means add up. The vertical bars mean absolute value: they turn every distance into a number that is zero or positive. Keeping the minus signs would not work, because the signed distances of any data set cancel out to a total of 0, so they could not show spread.
Replace the mean with the median and the same arithmetic gives the average distance from the median, which this calculator offers as a second option. The formula divides by n for any data, so there is no sample and population version of the mean absolute deviation.
How to find MAD by hand
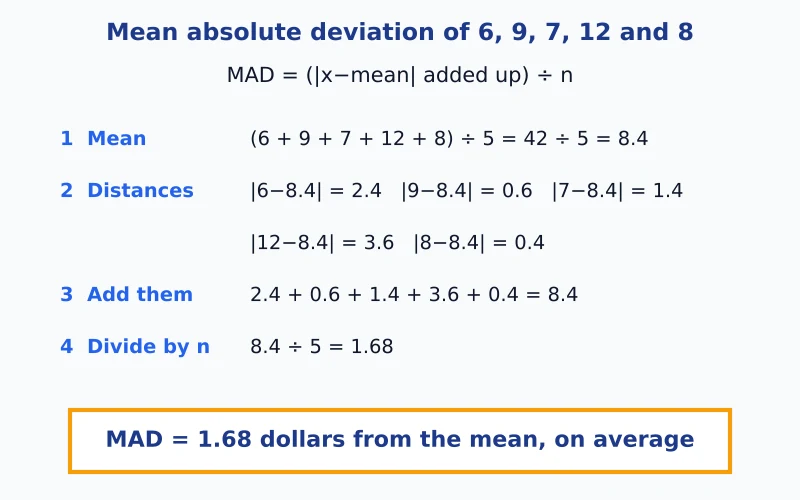
Take five lunch prices in dollars: 6, 9, 7, 12 and 8. Follow four steps:
- Find the mean: (6 + 9 + 7 + 12 + 8) ÷ 5 = 42 ÷ 5 = 8.4.
- Find each distance from 8.4 and drop the minus sign.
- Add the distances: 2.4 + 0.6 + 1.4 + 3.6 + 0.4 = 8.4.
- Divide by n: 8.4 ÷ 5 = 1.68.
| Price ($) | Price minus mean (8.4) | Absolute distance |
|---|---|---|
| 6 | -2.4 | 2.4 |
| 9 | 0.6 | 0.6 |
| 7 | -1.4 | 1.4 |
| 12 | 3.6 | 3.6 |
| 8 | -0.4 | 0.4 |
| Total | 0 | 8.4 |
The mean absolute deviation is 1.68 dollars. Paste 6, 9, 7, 12, 8 into the calculator and the distance table shows the same column. For the mean on its own, with every addition shown, use the mean tool.
Mean absolute deviation examples
Example 2, eight numbers (example 1 is the lunch prices above). Find the MAD of 4, 12, 2, 12, 20, 16, 12 and 18. The sum is 96 and n = 8, so the mean is 12. The distances from 12 are below.
| Value | Value minus mean (12) | Absolute distance |
|---|---|---|
| 4 | -8 | 8 |
| 12 | 0 | 0 |
| 2 | -10 | 10 |
| 12 | 0 | 0 |
| 20 | 8 | 8 |
| 16 | 4 | 4 |
| 12 | 0 | 0 |
| 18 | 6 | 6 |
| Total | 0 | 36 |
The MAD is 36 ÷ 8 = 4.5. Values that repeat, like the three 12s, sit right on the mean and add nothing to the total.
Example 3, test scores. Five scores are 52, 47, 55, 61 and 48. The mean is 52.6, the distances are 0.6, 5.6, 2.4, 8.4 and 4.6, and they add up to 21.6. Divide by 5 and the MAD is 4.32 points, so a typical score is about four points from the class average.
Reading the MAD and the bar chart
The bar chart draws the table. Each bar is one value’s distance from the mean, and the dashed line marks the MAD. In the lunch example the $6 and $12 meals are farther from $8.40 than the 1.68 average, so their bars cross the line. The $9, $7 and $8 meals sit closer, and their bars stop short of it.
Read a MAD in the context of your data. On exam scores out of 100, a MAD of 2 or 3 points means very uniform results, while 20 or 30 points means the scores are widely scattered. The same number can be large for one data set and small for another, so judge a MAD against the typical size of your values and their units. The chart is drawn for up to 40 values; longer lists still get the full table.
MAD about the mean or about the median
The usual MAD measures the distances from the mean. The “Measure distances from” choice lets you use the median as the center instead. For 10, 12, 11, 13, 12 and 60 the mean is 19.6667 and the MAD about the mean is 13.4444. The median is 12 and the average distance from it is only 8.6667, because the median is not pulled toward the 60.
Both are averages of the distances. A third measure, the median absolute deviation, takes the median of the distances instead and is a different calculation, so do not mix the names up. When you choose the median here, the result is labeled “about the median” to keep them apart.
MAD vs standard deviation
Both measure spread. The difference is how large distances are treated. MAD adds the plain distances, so every unit of distance counts the same. The standard deviation squares the distances first, so a value far from the mean counts for much more. So for data with an outlier the standard deviation comes out larger than the MAD: for 10, 12, 11, 13, 12 and 60 the MAD is 13.4444 and the sample standard deviation is 19.7855.
For data that follows a normal (bell-shaped) distribution, the MAD is about 0.798 times the standard deviation, so the standard deviation is about 1.253 times the MAD. The ratio falls below that when the data has heavy tails, which makes it a rough check on shape. MAD is easier to explain and to do by hand, which is why it appears in school math. The standard deviation is the one used with z-scores and the normal distribution. If you need it for your numbers, use the standard deviation tool. The all-in-one statistics calculator reports the mean absolute deviation too, among its 26 results, if you want everything in one run.
Compare the spread of two data sets
Two data sets can have the same mean and still differ in spread, and MAD shows by how much. Set A is 8, 9, 10, 11 and 12. Set B is 2, 6, 10, 14 and 18. Both have a mean of 10, but the MAD of A is 1.2 and the MAD of B is 4.8, so B’s values are four times as far from the mean on average.
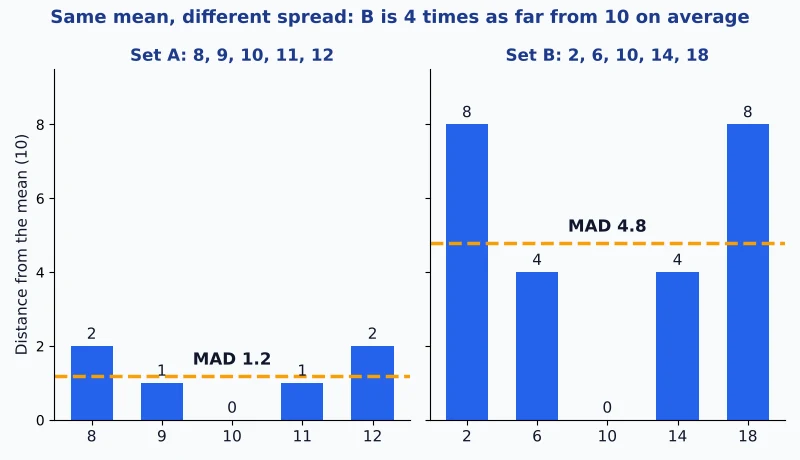
Press the “Two sets” example to load these lists in compare mode. Compare MADs only when the data is measured in the same units, for example two classes’ test scores out of 100. If the units or the averages differ, compare the relative spread (coefficient of variation) instead, which scales the spread by the mean. For the average squared distance, which is how the variance is built, use the variance tool. Want the middle value and the most common value of the same list? The mean median mode calculator gives both.
When MAD is not the best choice
The mean absolute deviation is built on the mean, so one typing mistake or extreme value drags both the mean and the MAD. For skewed data, such as incomes, the median absolute deviation resists that pull better. MAD also needs real numbers: it cannot summarize categories or text, and entries that are not numbers are left out. Use the standard deviation when later steps, such as z-scores, need it.
Excel and TI-84 steps for the MAD
Excel and Google Sheets have a function for the usual MAD. With the data in cells A1 to A7:
| You want | Excel / Google Sheets | TI-83/84 |
|---|---|---|
| MAD about the mean | =AVEDEV(A1:A7) | mean(L1) STO> M, then abs(L1-M) STO> L2, then mean(L2) |
| MAD about the median | =SUMPRODUCT(ABS(A1:A7-MEDIAN(A1:A7)))/COUNT(A1:A7) | same steps with median(L1) in place of mean(L1) |
The TI-84 has no MAD key, so type the values in L1 with STAT, EDIT, then run the steps on the home screen. In Excel, =AVEDEV measures from the mean and ignores blank and text cells. For values in A1:A5 with counts in B1:B5 (a frequency table), the MAD about the mean is =SUMPRODUCT(B1:B5*ABS(A1:A5-SUMPRODUCT(A1:A5,B1:B5)/SUM(B1:B5)))/SUM(B1:B5).
MAD calculator FAQs
What is the mean absolute deviation (MAD)?
The mean absolute deviation is the average distance between each value in a data set and the mean of that data set. “Absolute” means distances are counted without their minus signs. A MAD of 1.68 means the values are, on average, 1.68 units away from the mean.
What does MAD mean in math class?
In math class, MAD is short for mean absolute deviation, a measure of variability taught alongside the mean, median and range. Students find the mean, find each value’s distance from it, then average those distances. Do not confuse it with the median absolute deviation, a different measure met in more advanced statistics.
How do you find the mean absolute deviation?
Find the mean, subtract it from every value and drop the minus signs, add those distances, then divide by the number of values. For 6, 9, 7, 12 and 8 the mean is 8.4, the distances add up to 8.4, and 8.4 ÷ 5 = 1.68.
Is a high MAD good or bad?
Neither on its own. A high MAD only means the values are spread out, and a low MAD means they are close to the mean. Whether that is good depends on the job: a low MAD is what you want for part sizes or delivery times, while a high MAD is normal for something like household income. Only compare MADs for data measured in matching units.
Is mean absolute deviation the same as standard deviation?
No, although both measure spread. MAD averages the plain distances from the mean, while the standard deviation squares the distances first, so large distances count for more. For 10, 12, 11, 13, 12 and 60 the MAD is 13.4444 and the sample standard deviation is 19.7855. Use the standard deviation calculator when you need the standard deviation itself.
Is the MAD affected by outliers?
Yes, because it is built on the mean. For 10, 12, 11, 13 and 12 the MAD is 0.88. Add one value of 60 and it rises to 13.4444. The bar for the outlier is long, and it also drags the mean toward it, which lengthens the other bars.
Is mean absolute deviation the same as median absolute deviation?
No. The mean absolute deviation averages the distances from the mean. The median absolute deviation finds the median of the distances from the median, which makes it much less sensitive to outliers. This calculator gives the mean absolute deviation, with the option to measure the distances from the median instead of the mean.
Can the MAD be zero or negative?
It is never negative, because every distance is made positive before averaging. It is zero only when every value is the same, such as 5, 5, 5, 5, because then no value is away from the mean.
How do you find the MAD from a frequency table?
Find the mean using the frequencies, then multiply each value’s distance from the mean by its frequency, add those products and divide by the total frequency. Take the sizes 4, 6 and 8 with counts 1, 2 and 1: the total count is 4, the mean is 6, the weighted distances are 2 + 0 + 2 = 4, and 4 ÷ 4 = 1. You can also enter the list in full, 4, 6, 6, 8, and get the same MAD of 1.
Do you divide by n or n − 1 for the MAD?
Divide by n, the count of values. Unlike the sample variance and sample standard deviation, the mean absolute deviation has no n − 1 version, so this MAD calculator has no sample or population setting.
Why does mad() in R or Python give a different number?
In R, mad() returns the median absolute deviation multiplied by 1.4826, so it is a different measure from the mean absolute deviation. Older versions of pandas had a .mad() that averaged the distances from the mean, but it was removed in pandas 2.0. In Python you can get the mean absolute deviation with np.mean(np.abs(x – np.mean(x))).
Easy Stat Calc · Results checked against Python, R and Excel · Last updated November 10, 2026 · Methodology