
Find the chance of exactly, at most or at least k successes when you draw without putting items back, with the combinations worked out and the same answer in Excel and on a TI-84.
Loading calculator…
This free hypergeometric calculator, also called a hypergeometric distribution calculator, turns the size of the population, the number of successes in it and your sample size into the probability of exactly k, at most k, fewer than k, at least k or more than k successes, or of a count between a and b.
How to use this hypergeometric calculator
- Enter the population. N is the total number of items (52 cards), and K is how many of them count as successes (13 hearts).
- Enter the sample. n is how many items you draw without putting them back (5 cards).
- Choose the question (exactly, at most, fewer than, at least, more than, or between a and b) and enter k, the number of successes you want in the sample. For “between”, enter a and b; both ends are included.
- Press Calculate. You get the answer as a decimal and a percent, all five probabilities side by side, the mean, variance and standard deviation, the working with your numbers, a shaded bar chart, and the matching Excel and TI-83/84 commands.
Four example buttons fill in the numbers for you, so you can see how this hypergeometric distribution calculator works before you use your own data. The tool also shows the possible values of k. With 8 successes among 10 items and a sample of 5, for example, k can only be 3 to 5, so any smaller k has probability 0. If you are unsure which one fits, compare it with the other probability and distribution calculators. For a table of outcomes you type in yourself, use the distribution table calculator.
What is a hypergeometric distribution?
A hypergeometric distribution gives the probability of getting k successes in a sample of n items drawn without replacement from a population of N items, K of which are successes. Because nothing is put back, each draw changes the odds of the next one.
How to identify one: the population is finite and fixed, every item is either a success or a failure, the sample size is fixed in advance, and an item cannot be drawn twice. Drawing cards from a deck, picking defective parts from a lot and matching lottery numbers all fit.
The result is discrete: it can only be 0, 1, 2 and so on, from max(0, n + K − N) up to min(n, K).
Hypergeometric distribution formula
The probability of exactly k successes, the hypergeometric probability distribution, is:
P(X = k) = C(K, k) × C(N − K, n − k) / C(N, n)
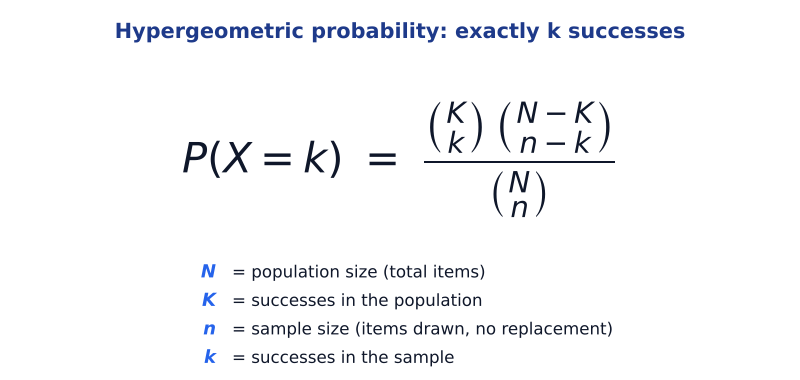
C(a, b) counts the ways to choose b items from a. The numerator counts the samples with exactly k successes, and the denominator counts all possible samples. The mean (expected value) is nK / N and the variance is n × (K/N) × (1 − K/N) × (N − n)/(N − 1). The last factor, (N − n)/(N − 1), is the finite population correction: it shrinks the spread compared with the binomial distribution.
Example: what is the chance of exactly 2 hearts in a 5-card hand? N = 52, K = 13, n = 5, k = 2. C(13, 2) × C(39, 3) / C(52, 5) = 78 × 9,139 / 2,598,960 = 712,842 / 2,598,960 = 0.2743, about 27.4%. The mean is 5 × 13 / 52 = 1.25 hearts, the variance is 0.864 and the standard deviation is 0.9295.

Exactly, at most, at least: cumulative hypergeometric probability
Threshold questions need a running total, the cumulative distribution function. The calculator adds the exact probabilities for you:
| You want | Symbol | How it is found |
|---|---|---|
| Exactly k | P(X = k) | the formula above |
| At most k (k or fewer) | P(X ≤ k) | P(0) + P(1) + … + P(k) |
| Fewer than k | P(X < k) | P(X ≤ k − 1) |
| At least k (k or more) | P(X ≥ k) | 1 − P(X ≤ k − 1) |
| More than k | P(X > k) | 1 − P(X ≤ k) |
| Between a and b | P(a ≤ X ≤ b) | P(X ≤ b) − P(X ≤ a − 1) |
With N = 52, K = 13, n = 5 and k = 2: P(X = 2) = 0.2743, P(X ≤ 2) = 0.9072, P(X < 2) = 0.6330, P(X ≥ 2) = 0.3670 and P(X > 2) = 0.0928. “Fewer than 2” and “at least 2” add up to 1.
Hypergeometric vs binomial distribution
Draw 5 cards from a deck and put each one back before the next draw, and the number of hearts follows a binomial distribution with p = 0.25. The chance of exactly 2 hearts is then 0.2637, compared with 0.2743 without replacement. The calculator shows this “with putting back” value under your result so you can see the difference for your own numbers.
The gap grows when the sample is a large part of the population and vanishes when it is small. A common rule of thumb is that the binomial is a good stand-in when the sample is at most 5% of the population. For counts of events over time, where there is no fixed population, use the Poisson calculator for event counts.
Hypergeometric calculator for card games
Players of Magic: The Gathering, Yu-Gi-Oh!, Pokémon, Disney Lorcana and other card games use the hypergeometric distribution to size a deck and judge an opening hand. A deck is a fixed population, the cards you want are the successes, and the cards you see are the sample. Enter N as the deck size, K as the number of copies or lands, and n as the cards you have drawn.
| Question | N, K, n | Chance |
|---|---|---|
| 2 or more lands in a 7-card opening hand | 60, 24, 7 | 85.7% |
| At least 1 land in the opening 7 | 60, 24, 7 | 97.8% |
| At least 1 of a 4-copy card, opening 7 | 40, 4, 7 / 60, 4, 7 / 99, 4, 7 | 55.2% / 39.9% / 25.8% |
| At least 1 of 8 removal spells, opening 7 | 60, 8, 7 | 65.4% |
| At least 1 of 12 copies of a role, opening 7 | 60, 12, 7 | 80.9% |
| One specific single card in the opening 7 | 60, 1, 7 / 99, 1, 7 | 11.7% / 7.1% |
On the play or on the draw. Enter n as 7 plus the cards you have drawn. The player on the draw takes a card on turn 1, so by turn 3 the sample is 10 cards; the player on the play skips that first draw, so it is 9 cards. For a 4-copy card in 60 cards, at least one copy is 0.5277 with 10 cards seen and 0.4875 with 9.
Mulligans. A new 7-card hand is a fresh sample from the full deck, so work out each hand separately. The chance that two hands in a row miss a 4-copy card is 0.6005 × 0.6005 = 0.3606, about 36.1%. This calculator does not track which cards you put on the bottom of the deck.
It handles two groups, success and not success. Drawing several different kinds of cards at once, such as removal and lands together, needs a multivariate hypergeometric calculation, which this page does not offer.
More hypergeometric examples
Quality control. A lot of 100 parts has 5 defective ones, and you inspect 10 without replacement. The chance that none is defective is C(5, 0) × C(95, 10) / C(100, 10) = 0.5838, so the sample would show no defect about 58% of the time even though the lot is not clean. The expected number of defective parts in the sample is 10 × 5 / 100 = 0.5.
Lottery. To match all 5 numbers drawn from 69 when you pick 5, N = 69, K = 5, n = 5 and k = 5, which gives 1 / C(69, 5) = 1 in 11,238,513.
For the chance of one event, two events together or repeated tries, use the basic probability calculator. To describe a data set rather than a draw, use the mean tool or the standard deviation calculator.
Hypergeometric distribution in Excel, Python and R
The examples use N = 52, K = 13, n = 5 and k = 2 and match the results above. Excel and SciPy order the arguments differently, so check the order before you type:
| Question | Excel | Python (SciPy) | R | TI-83/84 |
|---|---|---|---|---|
| P(X = 2) | =HYPGEOM.DIST(2, 5, 13, 52, FALSE) | hypergeom.pmf(2, 52, 13, 5) | dhyper(2, 13, 39, 5) | (13 nCr 2)*(39 nCr 3)/(52 nCr 5) |
| P(X ≤ 2) | =HYPGEOM.DIST(2, 5, 13, 52, TRUE) | hypergeom.cdf(2, 52, 13, 5) | phyper(2, 13, 39, 5) | sum(seq((13 nCr X)*(39 nCr (5-X))/(52 nCr 5),X,0,2)) |
| P(X ≥ 2) | =1-HYPGEOM.DIST(1, 5, 13, 52, TRUE) | hypergeom.sf(1, 52, 13, 5) | phyper(1, 13, 39, 5, lower.tail = FALSE) | 1-sum(seq((13 nCr X)*(39 nCr (5-X))/(52 nCr 5),X,0,1)) |
In Excel the order is (sample successes, sample size, population successes, population size). In SciPy it is (k, population size, population successes, sample size). In R, dhyper takes (k, successes in the population, failures in the population, sample size).
Hypergeometric calculator FAQs
How do I know if a problem is hypergeometric?
Check four things: a fixed population of N items, exactly two kinds of items (successes and failures), a fixed sample size n, and draws made without replacement. If the items are put back, or the chance of success stays the same on every draw, use the binomial distribution instead.
Is the hypergeometric distribution discrete or continuous?
It is discrete. It counts successes in a sample, so the result can only be a whole number from max(0, n + K − N) up to min(n, K).
How do I find the mean of a hypergeometric distribution?
Multiply the sample size by the share of successes in the population: mean = nK / N. For 5 cards from a 52-card deck with 13 hearts, the expected number of hearts is 5 × 13 / 52 = 1.25.
How do I calculate a hypergeometric distribution on a TI-84?
The TI-83 and TI-84 have no built-in hypergeometric command, so enter the formula with nCr from MATH, then PRB. For exactly 2 hearts, type (13 nCr 2)*(39 nCr 3)/(52 nCr 5), which gives 0.2743.
What is the difference between the hypergeometric and binomial distributions?
The binomial distribution assumes each draw has the same chance of success, as if each item were put back. The hypergeometric distribution draws without replacement, so the chance changes after every draw. The two give almost the same answer when the sample is a small part of the population, about 5% or less.
Easy Stat Calc · Results checked against Python, R and Excel · Last updated October 30, 2026 · Methodology